The SP 500 closed above 2,822 on Friday, March 15th, 2018, which was just the second close above that key level since early October 2018.
There have been three healthy corrections for the SP 500 since the 2008 bottom:
1.) 2011 – the SP 500 correction 19% – 20% from early May ’11 to early October 2011
2.) 2015 – 2016, which was a 13% – 14% correction lasting about 9 months, resulting from a strong dollar and weakness in China
3.) 2018 – 2019: this current correction was also 19% – 20% in severity and its length is unknown. The bottom is likely in for the SP 500 although the benchmark could remain range-bound and below the late September ’18 high of 2,940 – 2,941 for some time.
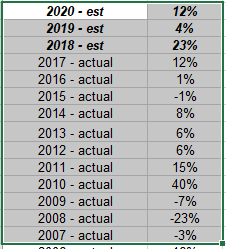
Here is a longer look at annual SP 500 EPS growth:

The Great Financial Crisis resulted in a 33% absolute drop in SP 500 earnings when looking at 2007 – 2009, but the SP 500 fell 50% – 55% peak-to-trough from October 2007 through March 2009, and then SP 500 earnings rocketed higher in 2010 and 2011, recovering all of the drop in earnings, and yet it took another 2 years for the SP 500 to make an all-time-high, which didn’t happen until May 2013.
In 2018, SP 500 earnings grew 23% (roughly, with two weeks left of reporting) and yet the SP 500 fell 4.35% on the year.
2019 is turning out to be a year of “P.E expansion” as SP 500 earnings may only grow mid-to-high-single digits, and yet the SP 500 is already up 13% year-to-date.
Weekly SP 500 Earnings data: by the numbers:
- Fwd 4-qtr est: $167.77 vs last week’s $167.83
- PE ratio: 17x
- PEG ratio: 5.6x
- SP 500 earnings yield: 5.94% vs last week’s 6.12%
- Year-over-year growth of fwd estimate: +3% vs last week’s vs last weeks +3%
Analysis / Conclusion: The last 5 week’s the y/y growth rate of the forward estimate has tracked in the 3% area, which indicates that SP 500 is starting to bottom. My own opinion is that SP 500 earnings will be markedly stronger by the end of 2019, but that is just one opinion.
The QQQ’s are already up 15% YTD, even though the Tech sector earnings – per the IBES earnings data – is expected to be down 1.4% for calendar 2019.
The Financial sector “expected” earnings growth is actually looking pretty strong, even though the sector is trading punk.
The expectation is that Q1 ’19’s “expected” SP 500 earnings growth of -1.5% currently, will be the low point for 2019.
The SP 500 is starting to discount some of that recovery already.
PE expansion and contraction throws a lot of pundits for a loop and for good reason.
