Last year, I penned an article titled: It’s a Turkey Market and with Thanksgiving just a couple of days away, I thought it was an apropos time to revisit that post.
What’s a ‘Turkey’ market? Nassim Taleb summed it up well in his 2007 book ‘The Black Swan.’
‘Consider a turkey that is fed every day. Every single feeding will firm up the bird’s belief that it is the general rule of life to be fed every day by friendly members of the human race ‘looking out for its best interests,’ as a politician would say.
On the afternoon of the Wednesday before Thanksgiving, something unexpected will happen to the turkey.
It will incur a revision of belief.’
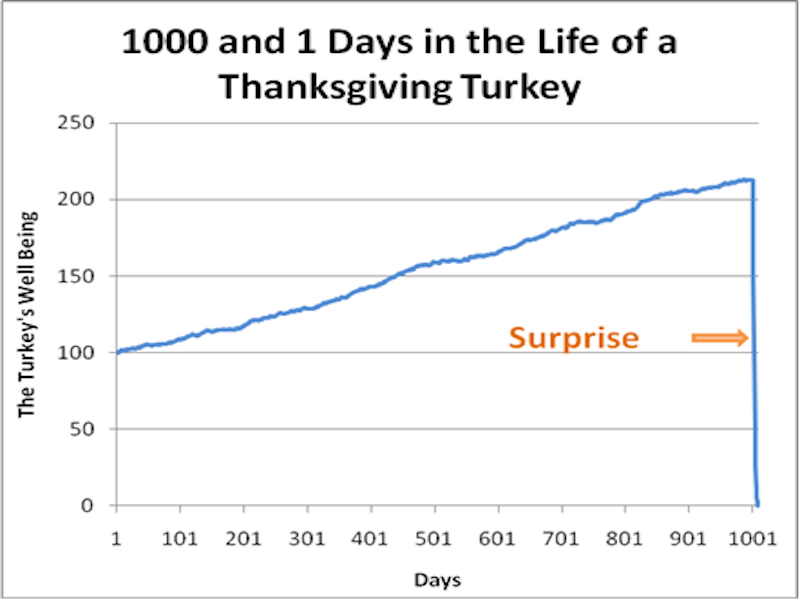
Such is the market we live in currently.
As I noted on Friday, despite two 10% corrections this year so far, investors have not yet “incurred a revision of belief” just yet. The VIX, Interest Rates and gold have yet to demonstrate that a change from “complacency” to “fear” has occurred.

As my friend and colleague Doug Kass noted previously:
Tops are a process and bottoms are an event, at least most of the time in the stock market. If you looked at an ice cream cone’s profile, the top is generally rounded and the bottom V-shaped. That is how tops and bottoms often look in the stock market, and I believe that the market is forming such a top now.
Take a look at the chart below which is the S&P 500 leading up to and following the Dot-com crisis.
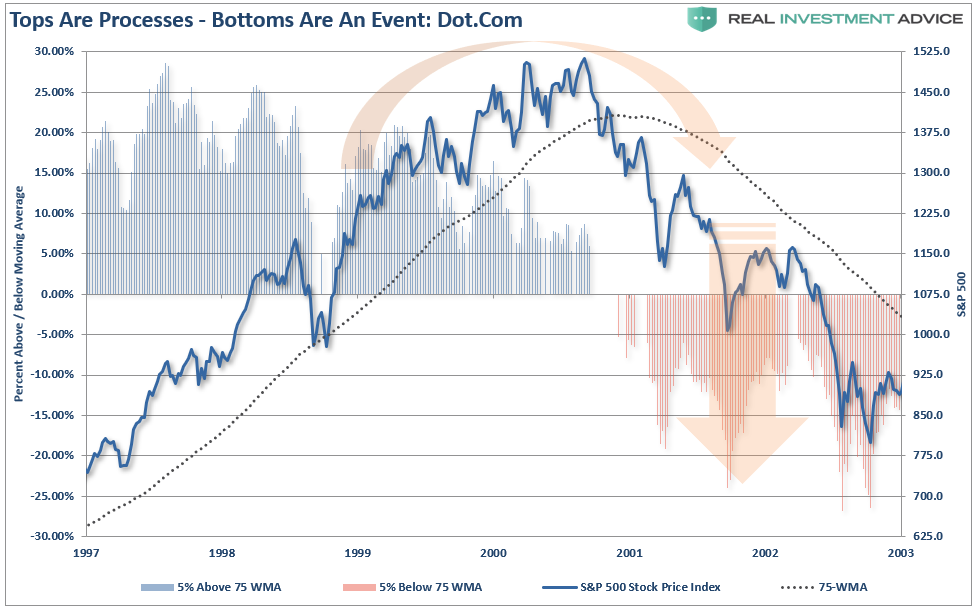
There are two very important things to notice with respect to that chart:
- You can see the “rolling top” of the market which began in 1999. Although prices were still rising, the rate of the increase slowed.
- Most importantly, note the deviation of the market from the 75-week moving average. The reversal of the deviation above the moving average was an indication of the change in trend that was approaching.
The same exact backdrop occurred leading up to the start of the “financial crisis” as well.
The market became extremely deviated above it’s long-term moving average. The “early warning” signal came as the deviation began to reverse as the market formed a “rounded top” once again.
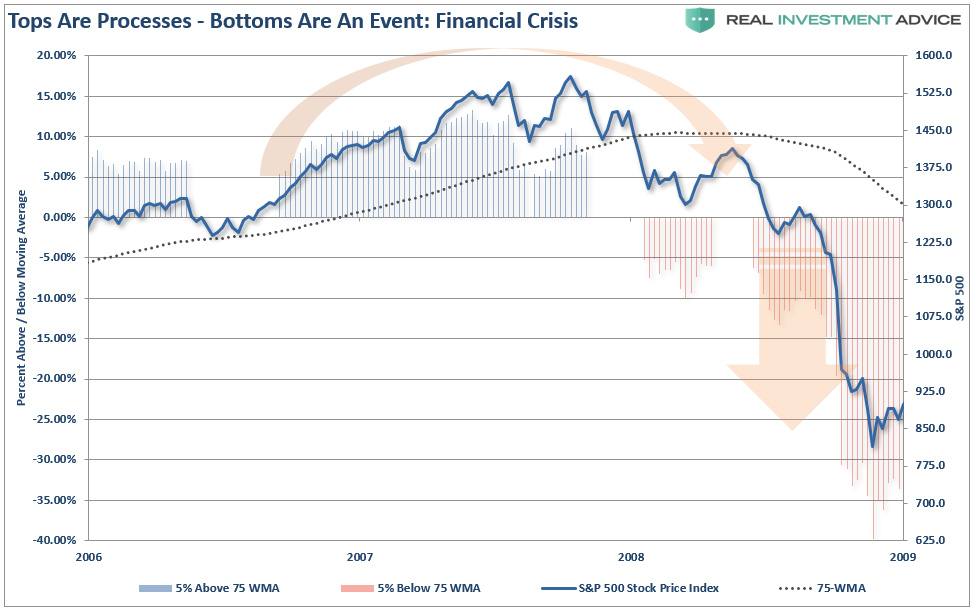
While obvious now, in hindsight, it wasn’t then. As I noted in this past weekend’s newsletter:
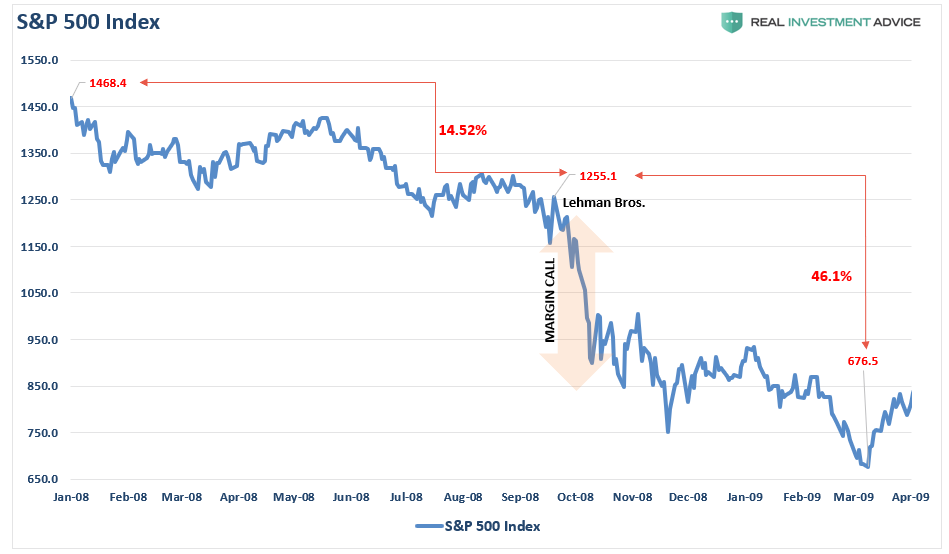
Notice that from January 1st through September of 2008 the market had already declined from the peak by 14.5%. This ‘slow-bleed’ decline was dismissed by the bullish media as we were in a ‘Goldilocks economy:’
- There was no sign of recession
- Rates were rising due to a strong economy.
- Earnings expectations were high and expected to continue to expand bringing “Forward P/E ratios” down to historical norms.
- Economic growth was robust and expected to accelerate in the next year.
- Global growth was expected to pick back up.
Sound familiar?
Fast forward to the current market and we again see much of the same backdrop. There are numerous issues which are issuing warning signs and undermine the “strong economy” narrative of the Fed. As Doug noted:
- Downside Risk Dwarfs Upside Reward.
- Global Growth Is Less Synchronized
- Market Structure Is One-Sided and Worrisome.
- Higher Interest Rates Make It Hard for the Private and Public Sectors to Service Debt
- Trade Tensions With China Are Intensifying
- Any Semblance of Fiscal Responsibility Has Been Thrown Out the Window
- Peak Buybacks.
- China, Europe and the Emerging Market Economic Data All Signal a Slowdown
Let me add a couple more:
- The Democrats won control of the House in the Mid-term elections which will effectively nullify fiscal policy agenda moving forward.
- The leadership of the market (FAANG) has faltered.
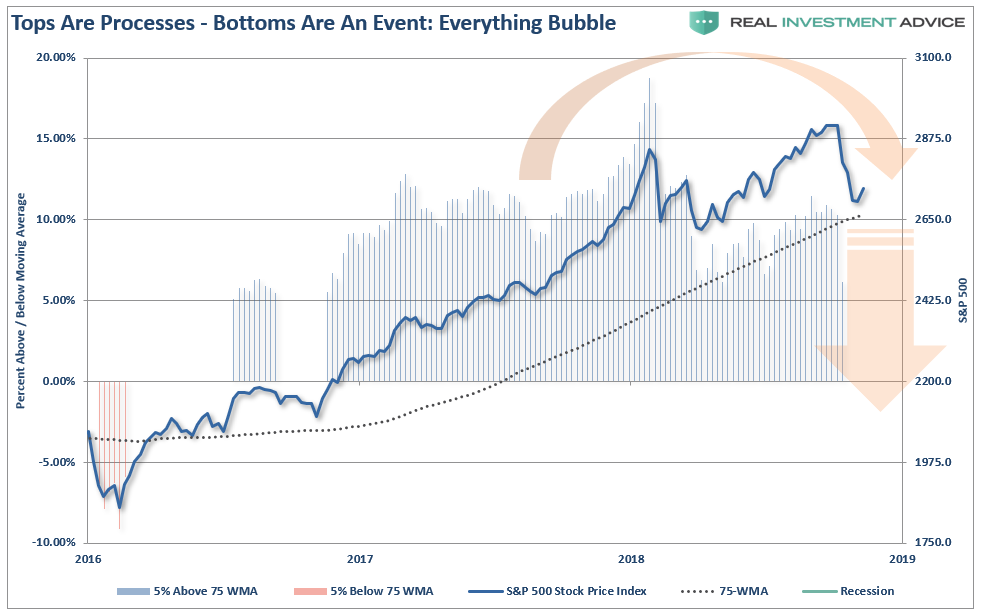
Importantly, notice the extreme deviation of the market above the long-term moving average which was the present condition prior to the last two market reversions.
The good news, currently, is the S&P 500 is still maintaining support at the 75-dma. However, it is highly likely that support will give way going into 2019 and a more significant reversion will ensue.
The Difference Between A Bull & Bear Market
Now, go back and review the two previous charts.
The difference between a “bull market” and a “bear market” becomes much clearer. During a bull market, prices trade above the long-term moving average. However, when the trend changes to a “bear market” prices trade below that moving average.
Yep, it’s pretty much just that simple.
Currently the “bull market” is still intact as prices remain above the long-term moving average. However, evidence continues to mount that support is at risk of giving way.
That is why this is a “Turkey” market.
Unfortunately, like Turkeys, we really have no clue where we are on the current calendar. We only know that today is much like yesterday, and while the weather has turned a bit colder and the leaves have changed colors, there is no reason to suspect much else has changed.
The recent sell-off has really been nothing more than a “correction in a bull market”…so far.
But the possibility of a “revision in belief” has clearly risen. Historically speaking, when such occurs, it has been the point where a “head separating event” occurs.
Importantly, this doesn’t mean you should “sell everything” and hide in cash. But it does mean that being aggressively exposed to the financial markets is no longer opportune.
You can try and fool yourself that weak earnings growth, low interest rates, and high-valuations are somehow justified. The reality is, like Turkeys, we will ultimately be sadly mistaken and learn a costly lesson.
