Bear Market Growl Grows Louder
Several months ago, I penned an article about the problems with “passive indexing” and specifically the problem of the “algorithms” that are driving roughly 80% of the trading in the markets. To wit:
“When the ‘robot trading algorithms’ begin to reverse (selling rallies rather than buying dips), it will not be a slow and methodical process, but rather a stampede with little regard to price, valuation, or fundamental measures as the exit will become very narrow.”
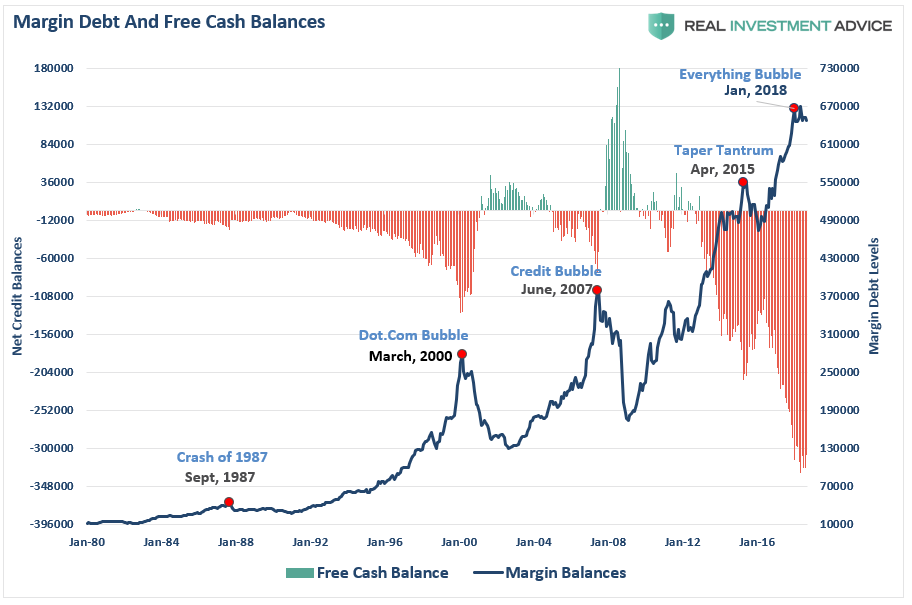
Fortunately, up to this point, there has not been a triggering of margin debt, as of yet, which remains the “gasoline” to fuel a rapid market decline. As we have discussed previously, margin debt (i.e. leverage) is a double-edged sword. It fuels the bull market higher as investors “leverage up” to buy more equities, but it also burns “white hot” on the way down as investors are forced to liquidate to cover margin calls. Despite the two sell-offs this year, leverage has only marginally been reduced.
If you overlay that the S&P 500 index you can see more clearly the magnitude of the reversions caused by a “leverage unwind.”
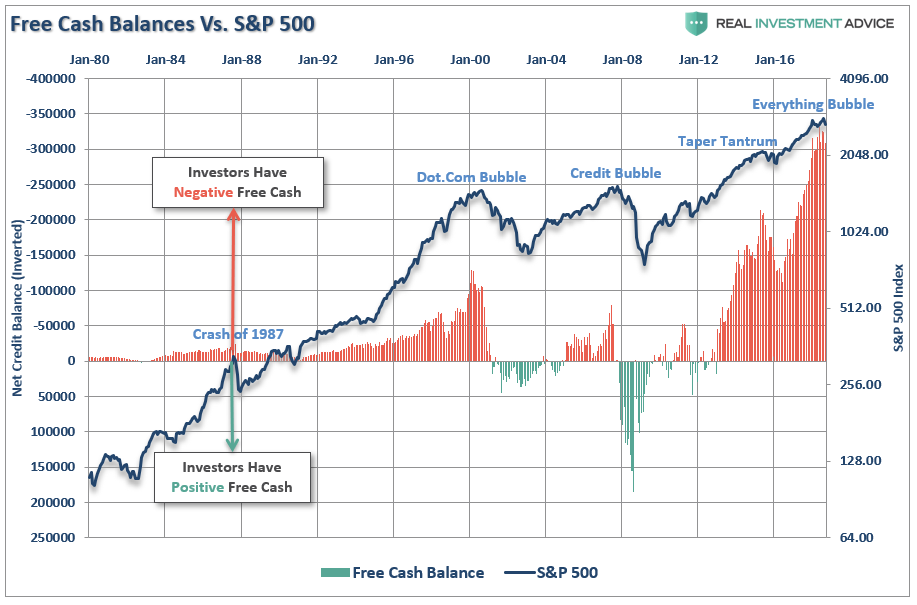
The reason I bring this up is that, so far, the market has not declined enough to “trigger” margin calls.
At least not yet.
But exactly where is that level?
There is no set rule, but there is a point at which the broker-dealers become worried about being able to collect on the “margin lines” they have extended. My best guess is that point lies somewhere around a 20% decline from the peak. The correction from intraday peak to trough in 2015-2016 was nearly 20%, but on a closing basis, the draft was about 13.5%. The corrections earlier this year, and currently, have both run close to 10% on a closing basis.
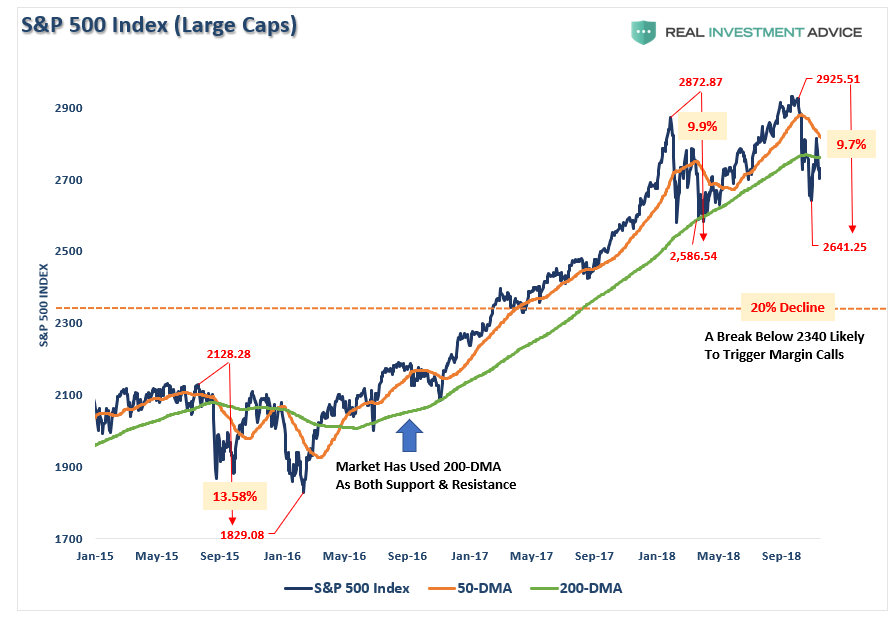
My best guess is that if the market breaks the October lows, which given the current state of the market is a very high probability, we will likely see an accelerated “sell off” as the realization a “bear market” starts to set in. If the such a decline triggers a 20% fall from the peak, which is around 2340 currently, broker-dealers are likely going to start tightening up margin requirements and requiring coverage of outstanding margin lines.
This is just a guess…it could be at any point at which “credit-risk” becomes a concern. The important point is that “when” it occurs, it will start a “liquidation cycle” as “margin calls” trigger more selling which leads to more margin calls. This cycle will continue until the liquidation process is complete.
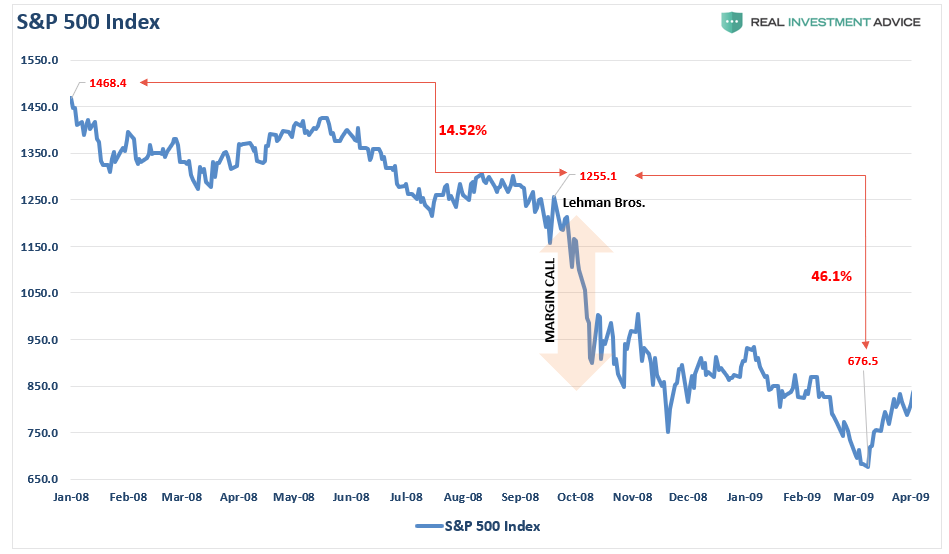
The last time we saw such an event was here:
Notice that from January 1st through September of 2008 the market had already declined from the peak by 14.5%. This “slow-bleed” decline was dismissed by the bullish media as we were in a “Goldilocks economy:”
- There was no sign of recession
- Rates were rising due to a strong economy.
- Earnings expectations were high and expected to continue to expand bringing “Forward P/E ratios” down to historical norms.
- Economic growth was robust and expected to accelerate in the next year.
- Global growth was expected to pick back up.
Sound familiar?
Then, the “Lehman moment” occurred and the world changed and the realization we were in a recession would occur 3-months later.
From the end of September to March of 2009, the market lost an additional 46.1%. The bulk of the at loss occurred quickly as banks and brokerage firms scrambled to pull in margin lines.
The selling was relentless. It was also where many individuals found out there is a point where portfolios become an “Imported Rug Store” and “Everything Must Go.”
This is the problem with “margin debt.”
This is why we continue to urge caution.
The “bear market” in stocks is growling more loudly.
Last week, we further reduced equity risk further bringing exposures down to just 43% of our portfolios. On a rally to the 200-dma which fails, we will reduce risk more.
Daily View
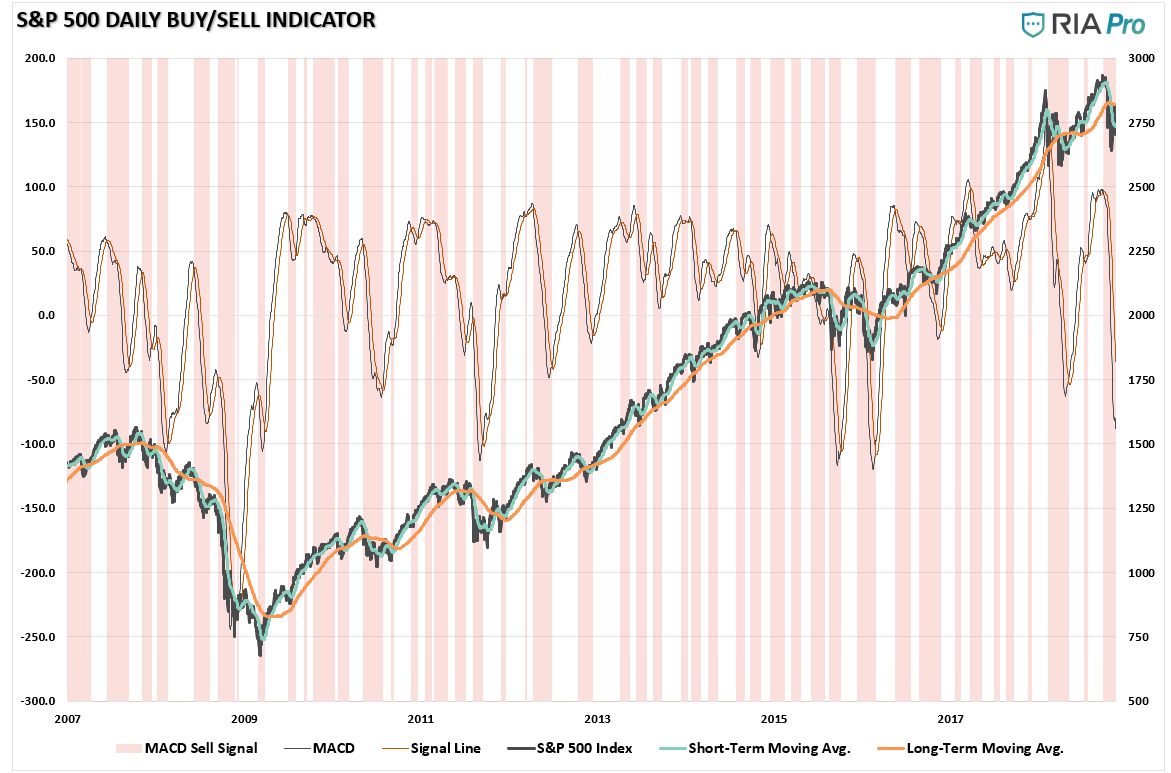
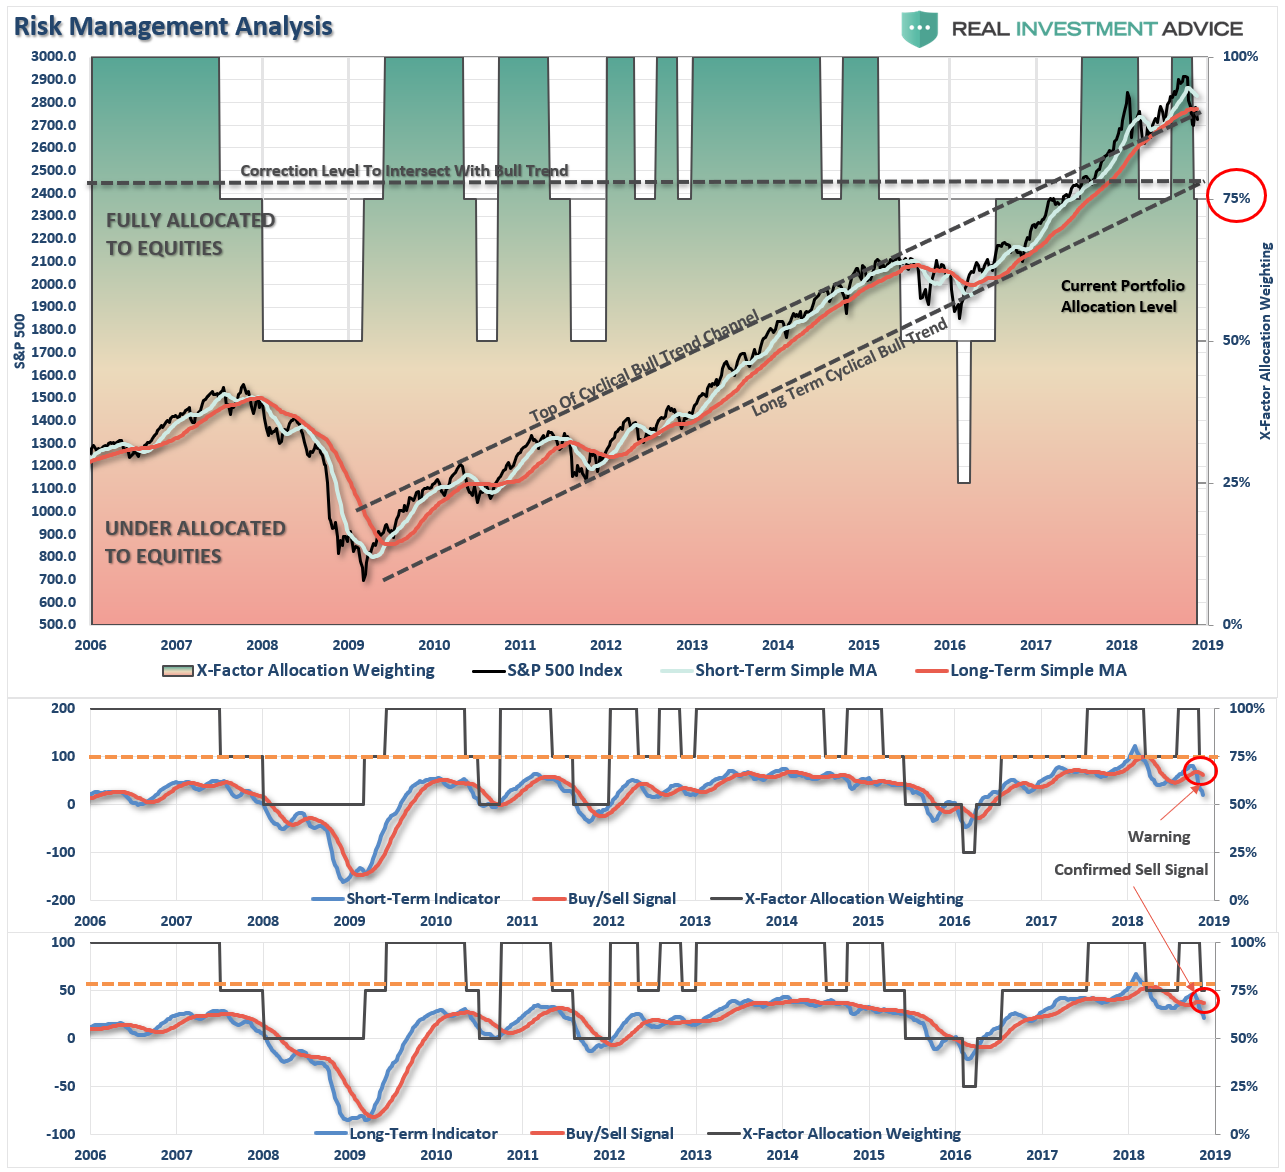
This week we are going to review our primary buy/sell indicator charts for the S&P 500. As shown below, the daily chart is much more noisy in terms of signals and is meant for more short-term trading activity. However, what is important is the signals are fairly good (pink shaded bars) at catching downturns in the market and suggesting a reduction in overall risk exposure. That is the case once again over the last month.
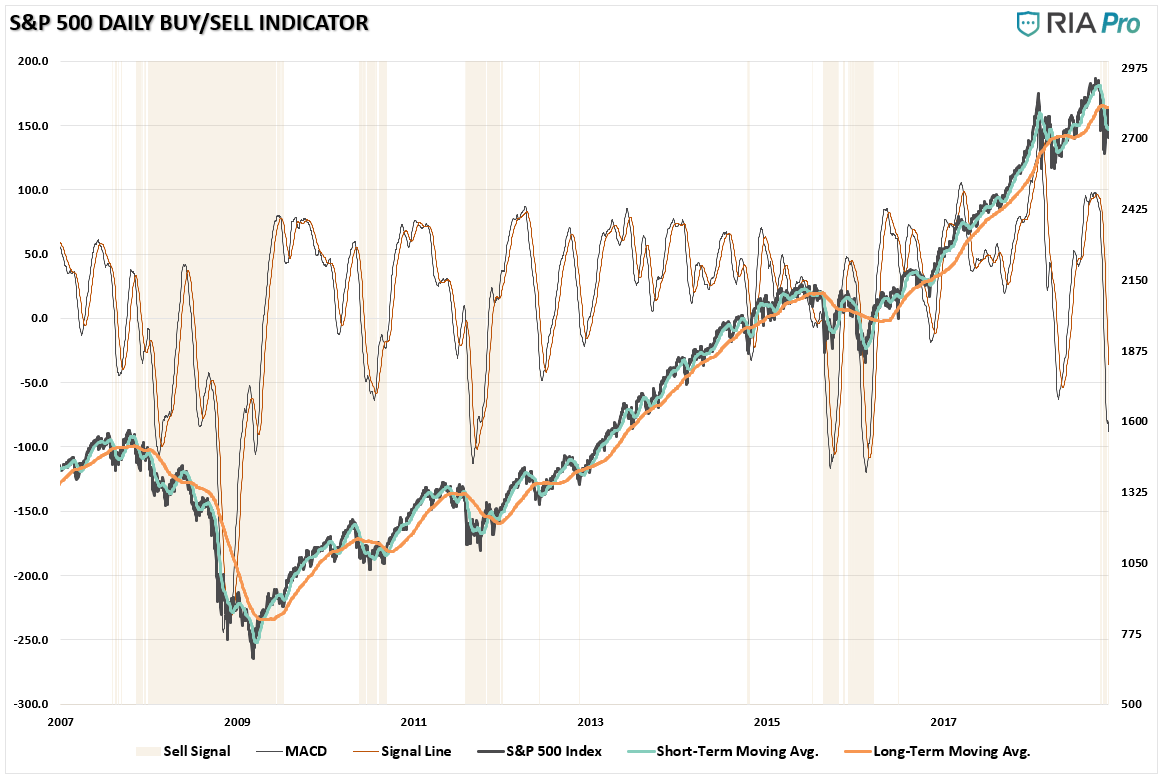
We can slow the signals down reducing the signal to just breaks of the long-term moving average. Once again we see a fairly consistent ability to navigate the more important downturns in the market. Importantly, the sell-off in January did NOT violate the long-term moving average and therefore did not register a sell-signal. However, the current sell-off just triggered that signal to reduce equity risk this past week.
Action: After reducing exposure in portfolios previously, we reduced risk further this past week. Sell weak positions into any market strength on Monday.
Weekly View
Since we prefer longer-term holding periods for our positions, we prefer to use weekly and monthly price periods as it reduces the number of signals significantly. This allows us to capture the trends of the market while still managing to protect capital from more significant declines.
(Note: this does not mean we will miss ALL the declines. It simply means we will avoid the risk of a more substantial decline should one occur. We are NOT “market timers” but rather “risk managers.”)
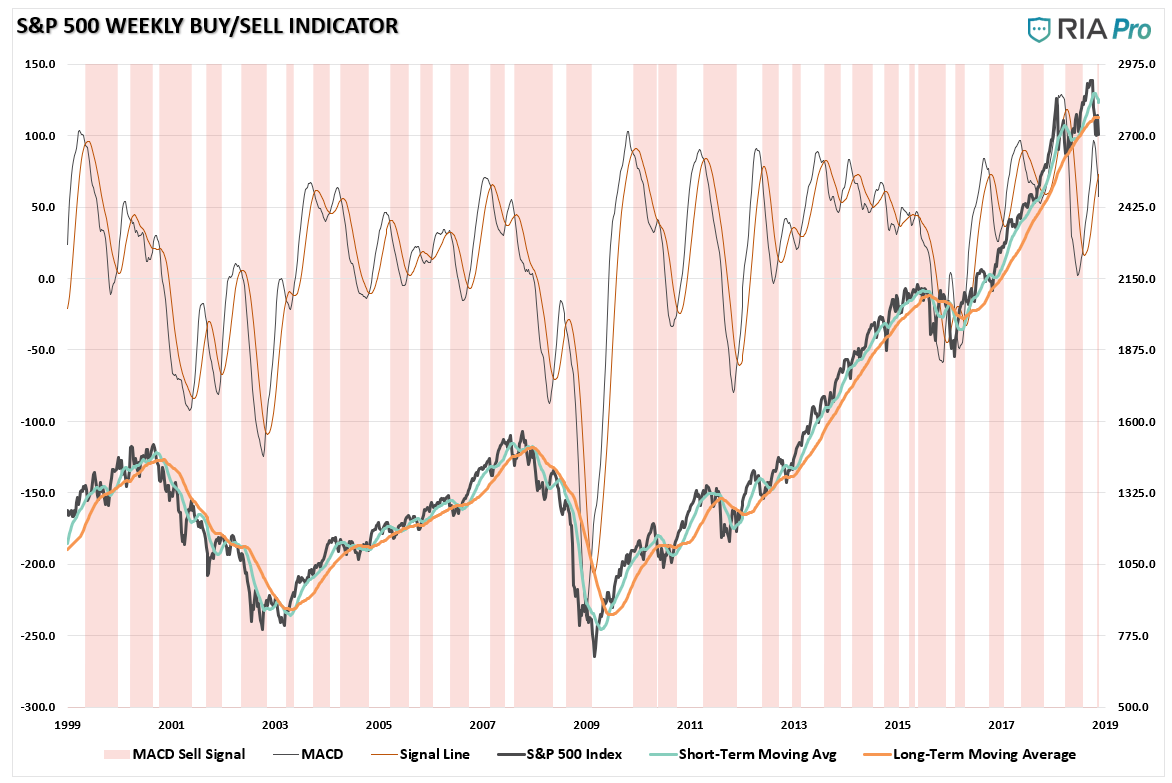
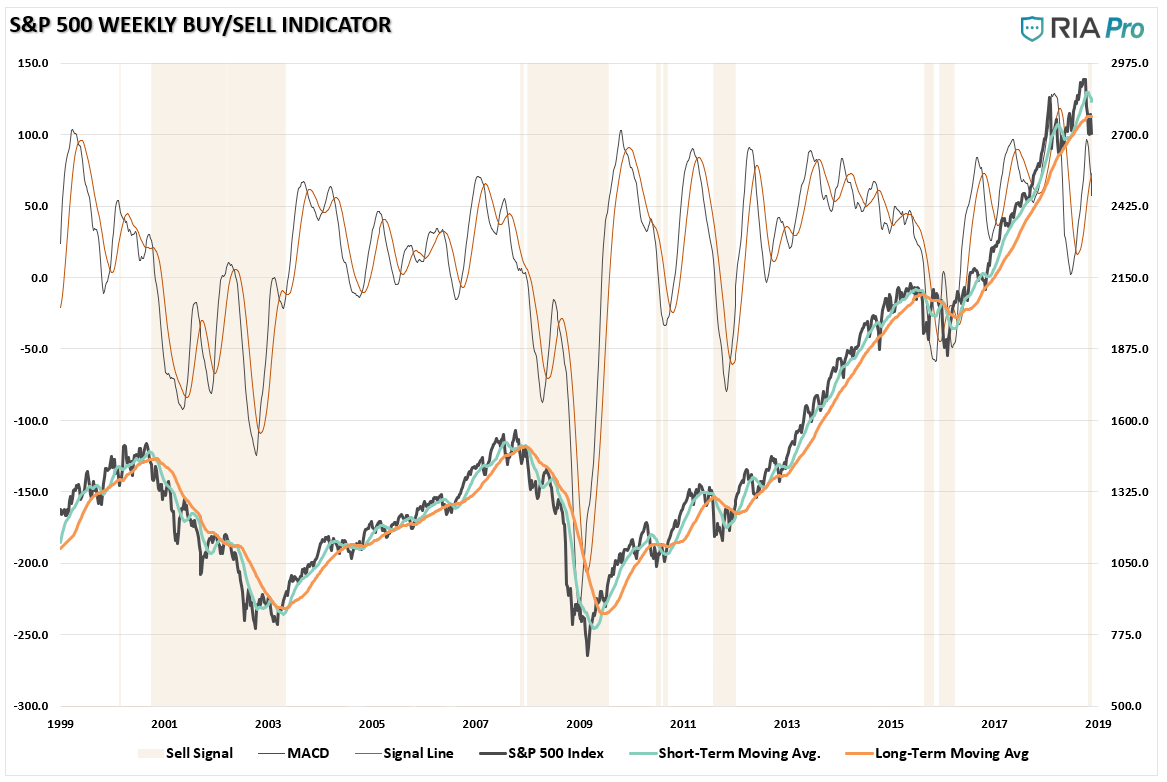
As shown below, on a weekly basis, a “sell signal” has been registered for the second time this year suggesting that investors reduce equity risk in portfolios.
Again, we can reduce the number of signals further by using a confirmed cross of a long-term moving average. This process keeps portfolios primarily allocated toward equity risk over long periods of time. When “sell signals” occur, they tend to be important to pay attention to.
This past week a “sell signal” was issued.
I want to caution you that by the time longer-term sell signals are issued, the market tends to be more extremely oversold and due for a reflexive bounce. In 2015, we saw a significant bounce that was worth selling into before the next decline in 2016. It was the intervention of the global Central Banks in 2016 that kept a “bear market” from most likely ensuing.
Today, Central Banks are extracting liquidity and show no intent in coming to markets rescue. It is likely wise to use any bounce over the next few weeks to reduce risk and raise cash.
Action: Sell weak positions into any strength next week.
Monthly View
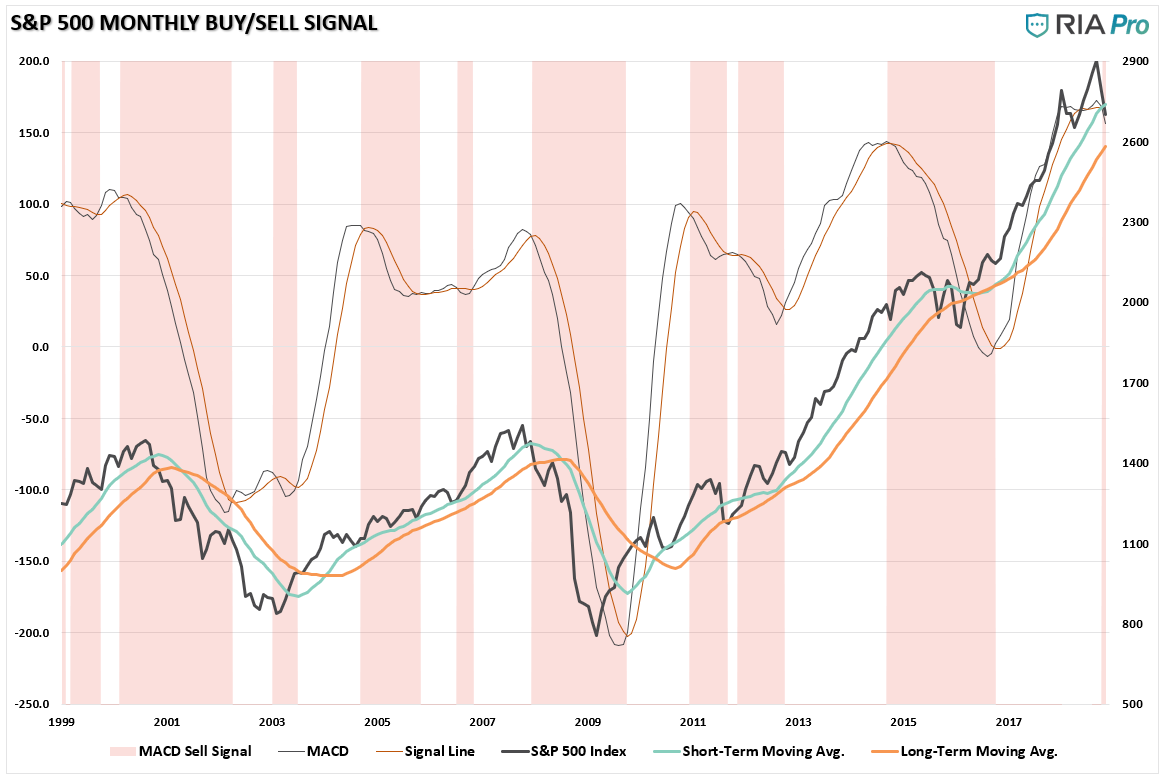
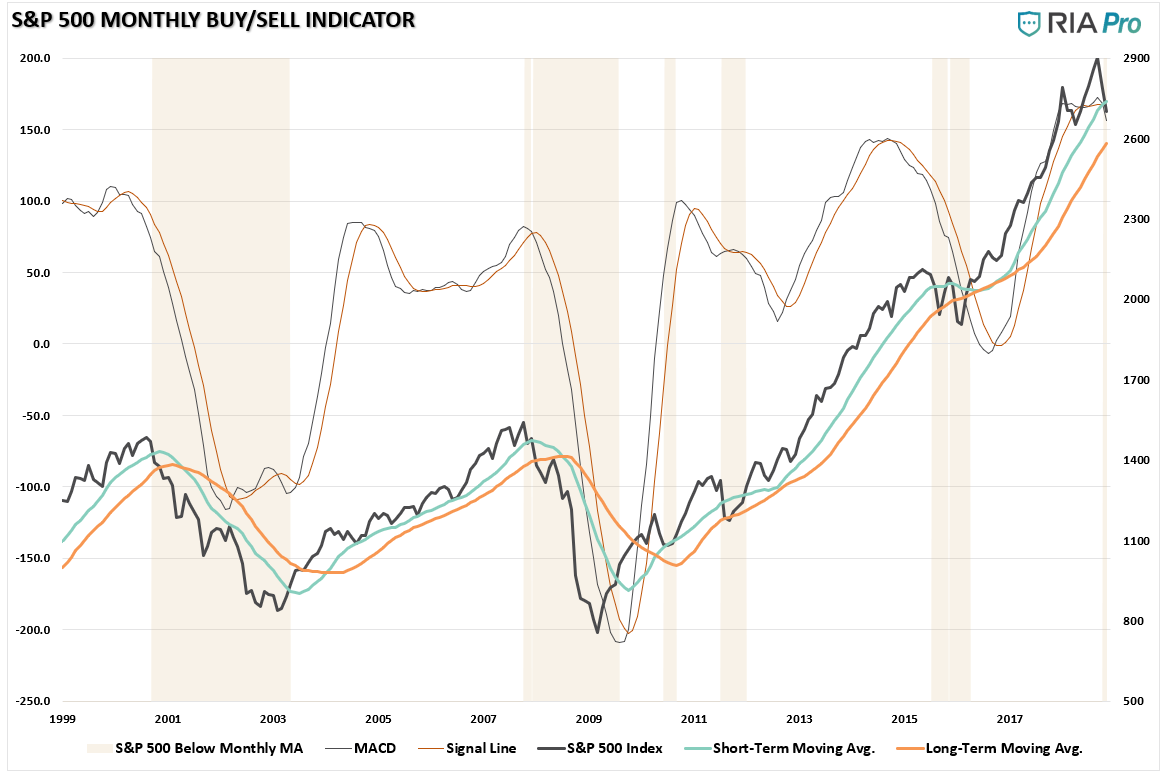
Moving back to a monthly view, signals become much slower and much more important. However, signals are ONLY VALID on the 1st trading day of each month. Therefore, while the markets have registered a monthly signal as of this week, it will ONLY be valid if the markets fail to rally enough to reverse it by the end of the month.
Nonetheless, the deterioration in the markets is extremely concerning and by slowing the signals down further to crosses of very long-term moving average, the risk to investors becomes much clearer.
Action: Reduce risk on rallies, as detailed above, and look to add hedges.
As always, the messages being sent by the market are more than just concerning and DO suggest, as we have stated on the last couple of weeks, that the bull market has indeed ended for now.
It is make or break for the markets over the next couple of weeks. If the markets fail to rally, more important long-term “sell signals” will be triggered which will likely suggest further declines in the markets are in the offing.
Of course, with a Fed bent on continuing to lift interest rates, earnings showing real signs of deterioration, ongoing trade wars and tariffs, continued reductions in Central Bank liquidity, and corporations curtailing share buybacks – the market appears to be finally starting to “run on empty.”
Next week, we will look to raise more cash and add hedges on any failed rally attempt at the 200-dma for now.
As always, we will keep you apprised of what we are thinking.
You can also follow our actual portfolio models and positioning at RIA PRO.
See you next week.
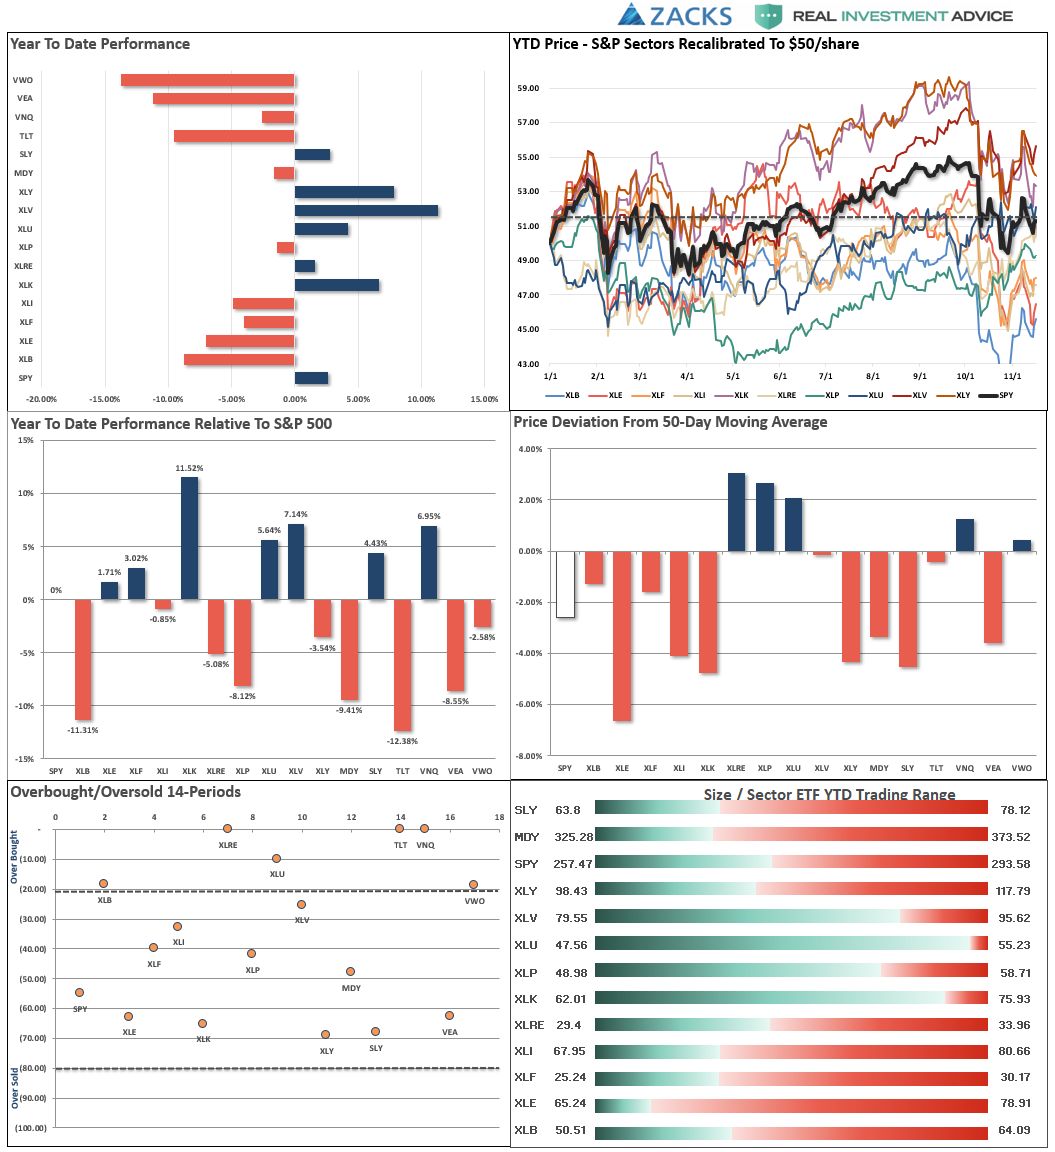
Market & Sector Analysis
Data Analysis Of The Market & Sectors For Traders
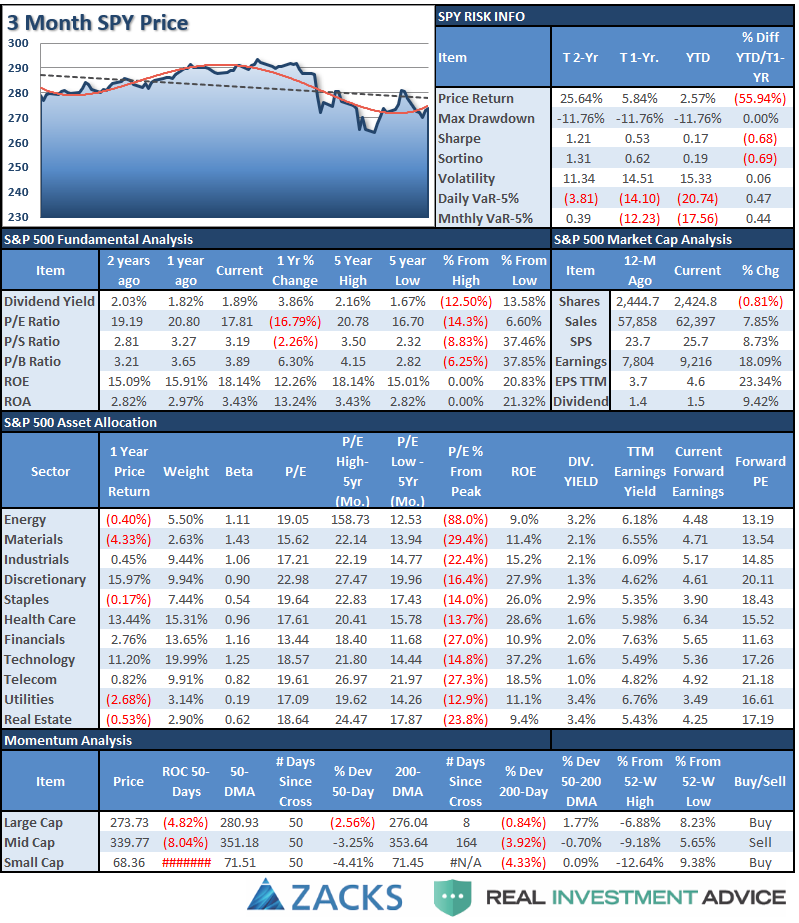
S&P 500 Tear Sheet
Performance Analysis
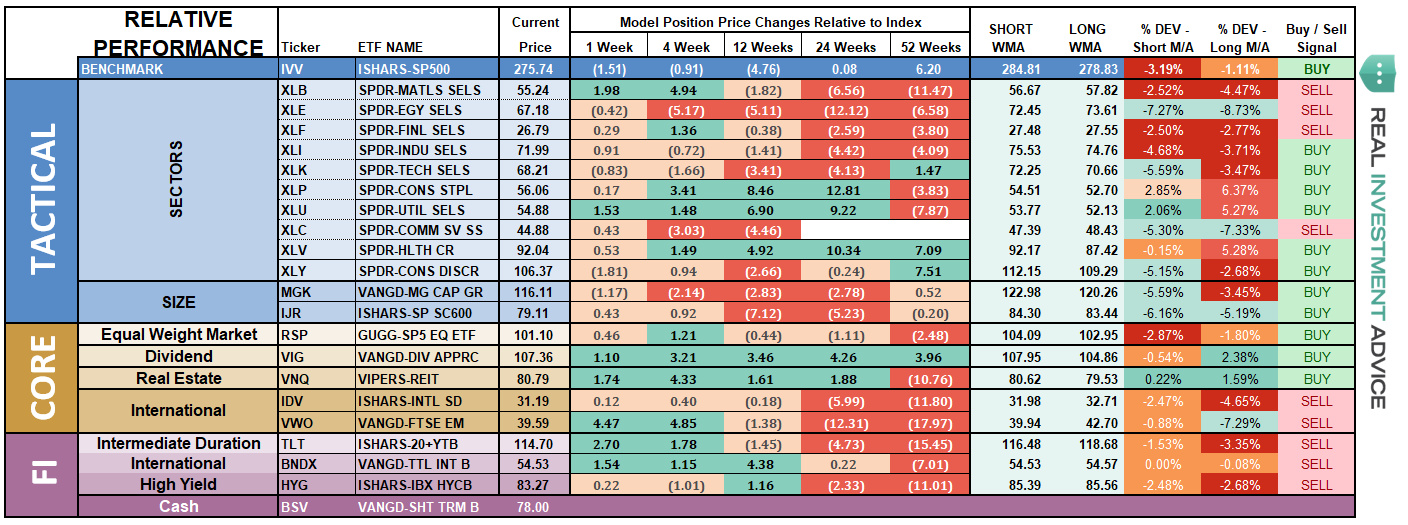
ETF Model Relative Performance Analysis
Sector & Market Analysis:
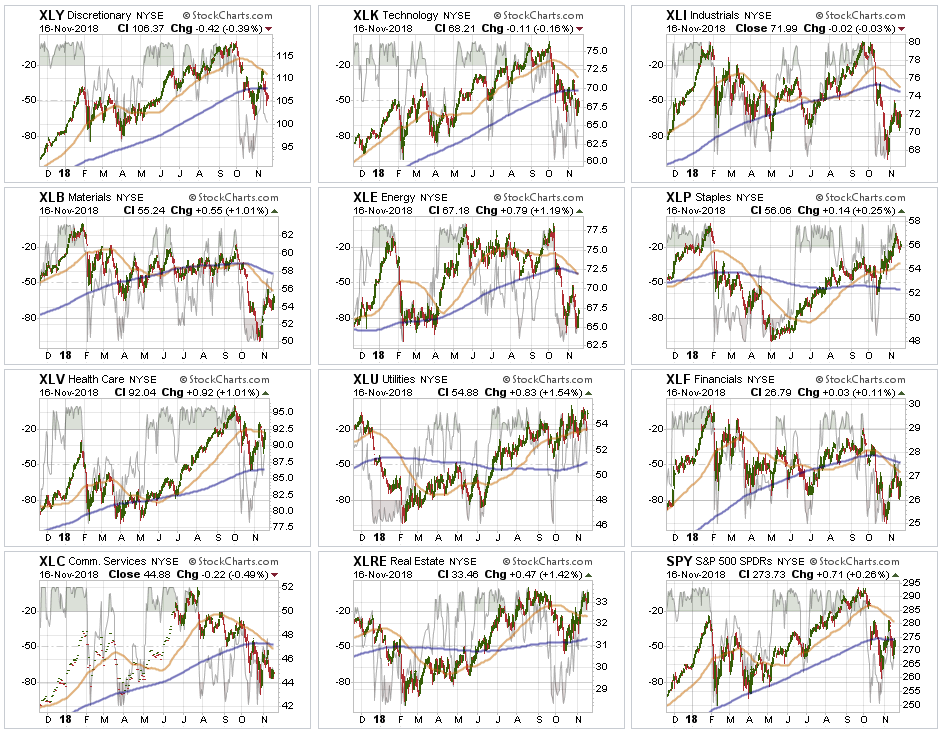
Sector-by-Sector
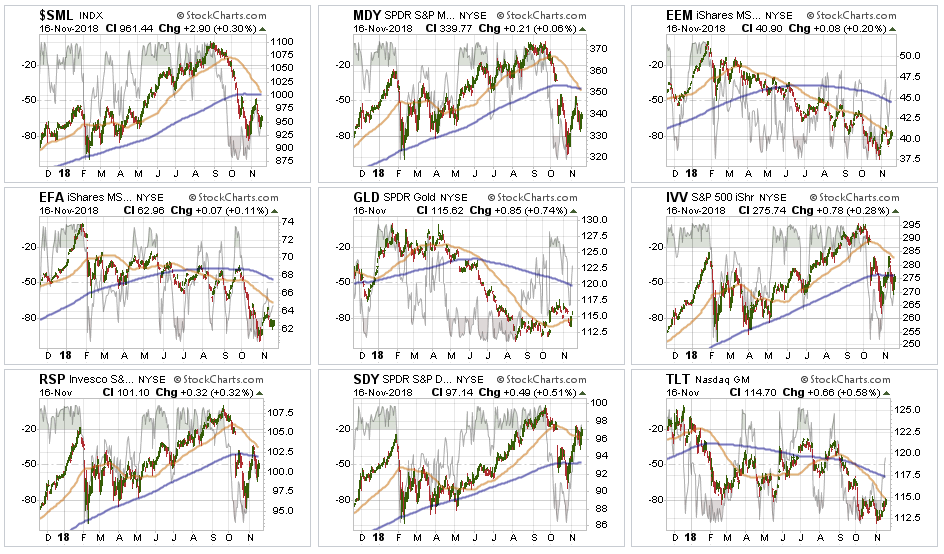
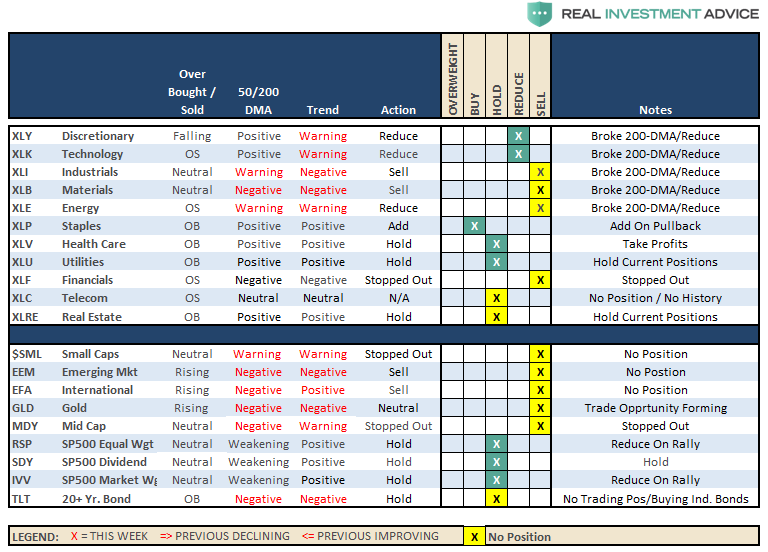
Discretionary and Technology Last week, we noted that both sectors rallied and failed at important overhead resistance at the 200-dma. We also suggested “taking profits and look at the 200-dma support as critical.” Last week both sectors broke back below the 200-dma and we sold our positions in XLK on that reversal.
Industrials, Materials, Energy, Financials, Communications – we are currently out of all of these sectors as the technical backdrop is much more bearish. While oil prices to bounce off important support last week, and is oversold, the energy sector has completely fallen apart. We continue to suggest reducing exposure on any rally next week.
Real Estate, Staples, Healthcare, and Utilities continue to be bright spots. Last week, these sectors pulled back some as there was a bit of rotation in the. We will look to increase our weightings to these areas opportunistically for now. However, if we get into a more protracted bear market, these sectors will not be immune to the decline so caution remains high.
Small-Cap and Mid Cap – Small-cap is extremely close to registering a macro sell signal as the 50-dma crosses below the 200-dma. Mid-caps already have. After having closed out of our positions in these areas we continue to look to reduce risk further on any rally in the markets next week.
Emerging and International Markets rallied last week a bit after recently hitting new lows but, like small and mid-cap markets continue to fail at declining resistance levels. With a major sell signal in place currently, there is still no compelling reason to add these markets to portfolios at this time.
Dividends, Market, and Equal Weight – The overall market dynamic has changed for the negative in recent weeks. Currently, Dividends are outperforming Equal and Market Weight indices as the chase for yield and safety has weighed on more aggressive sectors of the market. Use the recent rally to reduce overall equity risk for now.
Gold – While the precious metal found a small “bit of love” last week, it was more like a “quick peck on the cheek” rather than a “passionate kiss.” Gold remains in a downtrend, but the good news is the 50-dma has turned up. We are still looking for a “sign” there is a committed trade to the metal before getting back in after having been out of the trade since 2013. Stops remain at $111 if you are still long the metal.
Bonds – rallied last week and are testing their declining 50-dma. With a short-term buy signal in place but very overbought, it is not yet time to lay on a trade just yet. We remain long our core bond holdings for capital preservation purposes but all trading positions are currently closed.
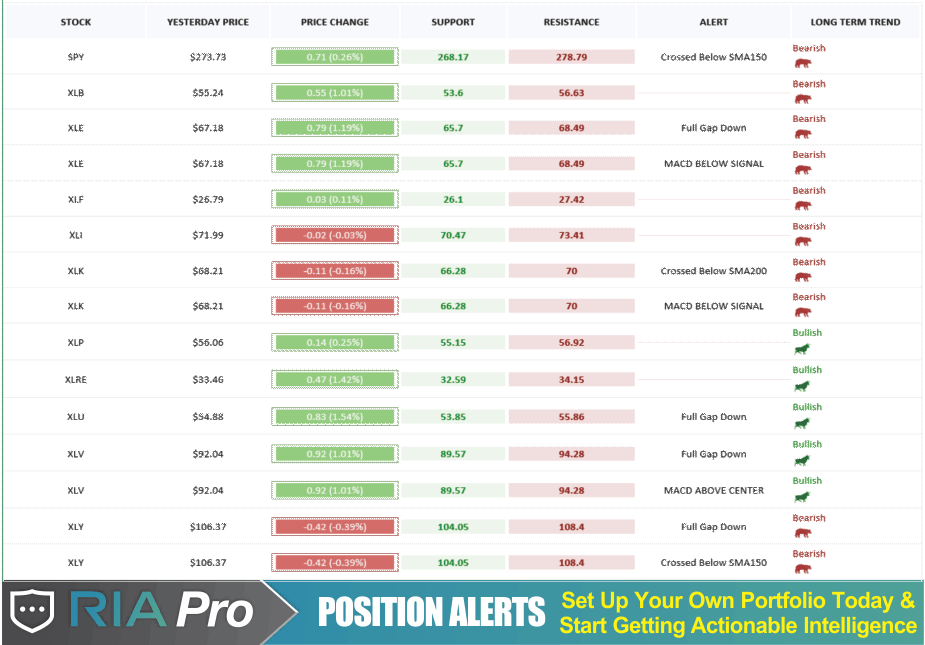
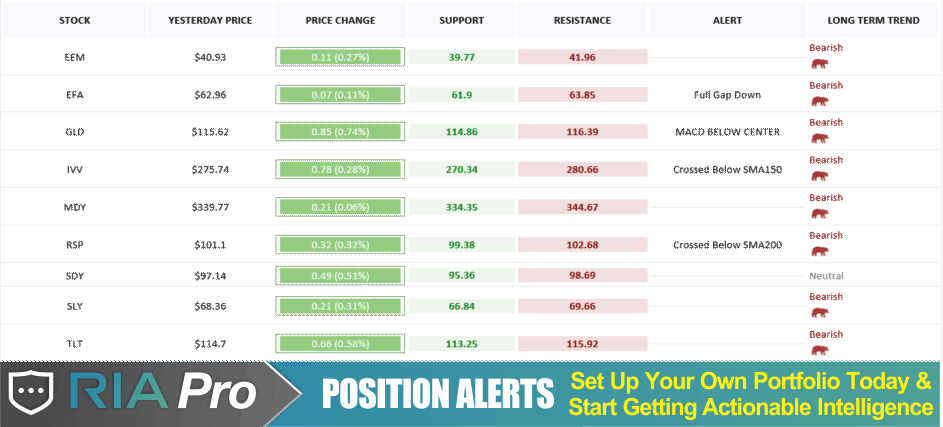
The table below shows thoughts on specific actions related to the current market environment.
(These are not recommendations or solicitations to take any action. This is for informational purposes only related to market extremes and contrarian positioning within portfolios. Use at your own risk and peril.)
Portfolio/Client Update:
As noted last week, the market action remains troubling, to say the least. The bullish trend longer-term remains intact but more bearish dynamics are rising.
It is important we do not get OVERLY cautious right now, but we are comfortable holding some extra cash right now. Last week, we removed our overweight in Technology and will look to take some additional actions as needed this week in Discretionary holdings.
- New clients: We will continue to sell down “out of model” holdings and raise cash on rallies.
- Equity Model: After having sold some positions two weeks ago, we are maintaining a slightly higher weight in cash. We will be looking to sell two to three more positions next week on any strength.
- Equity/ETF blended – Same as with the equity model.
- ETF Model: We sold XLK last week and will look to reduce XLY on any rally. With portfolios carrying a good bit of cash, we can just wait to see where the next opportunity emerges.
While the pick up in volatility is certainly not enjoyable, we don’t want to let our emotions get the better of our discipline. We remain vigilant of the risk currently and are happy to err to the side of caution until a new trend emerges.
THE REAL 401k PLAN MANAGER
The Real 401k Plan Manager – A Conservative Strategy For Long-Term Investors
There are 4-steps to allocation changes based on 25% reduction increments. As noted in the chart above a 100% allocation level is equal to 60% stocks. I never advocate being 100% out of the market as it is far too difficult to reverse course when the market changes from a negative to a positive trend. Emotions keep us from taking the correct action.
Using Rallies To Reduce Risk Further
As I stated last week:
“Next week, it is critically important for the market to rally IF the bulls are going to regain control of the market.”
It didn’t and the bulls are in a very weak position currently.
We are also close to registering a much more important long-term signal to reduce risk in portfolios even more. As stated in the main body of this missive, there are mounting signs the bulls have lost control of the market.
Two weeks ago, we lowered the allocation model to 75% of target for now. As we said then:
“There is more risk to the downside currently than upside reward. But…let me repeat:
This does NOT mean immediately go out and sell 25% of your holdings. The model moves in 25% increments as signals are triggered. However, by the time a signal is triggered, the market tends to be very oversold which is why we wait for a bounce to opportunistically sell into.
It also doesn’t mean to go liquidate 25% of your exposure all at once. These are just model targets that you ‘adjust’ into as market dynamics develop.
Last week, we will be reducing equity risk in our managed 401k portfolios by another 5% this week. As long as the market remains in a more negative trend we will continue to use rallies to reduce equity further as needed.
Continue to use rallies to reduce risk towards a target level with which you are comfortable. Remember, this model is not ABSOLUTE – it is just a guide to follow.
Defense remains our primary strategy for 401k-plans currently.
- If you are overweight equities – reduce international, emerging market, mid, and small-capitalization funds on any rally next week. Reduce overall portfolio weights to 75% of your selected allocation target.
- If you are underweight equities – reduce international, emerging market, mid, and small-capitalization funds on any rally next week but hold everything else for now.
- If you are at target equity allocations reduce overall equity exposure to 75% of your allocation target on any rally next week.
Unfortunately, 401k plans don’t offer a lot of flexibility and have trading restrictions in many cases. Therefore, we have to minimize our movement and try and make sure we are catching major turning points. Over the next couple of weeks, we will know for certain as to whether more changes need to be done to allocations as we head into the end of the year.

