A Note About That Jobs Number
On Friday, the Bureau Of Labor Statistics released the widely expected employment report for May. Despite continued weekly jobless claims over the last month exceeding more than 8-million, the BLS reported an increase of more than 2.5 million jobs in May. The unemployment rate came in at just 13.3% well below the consensus estimates of 17-19%.
Both of these numbers were historical records surpassing any period back to the “Great Depression.”
Let’s start by taking a look at the raw numbers from the BLS.
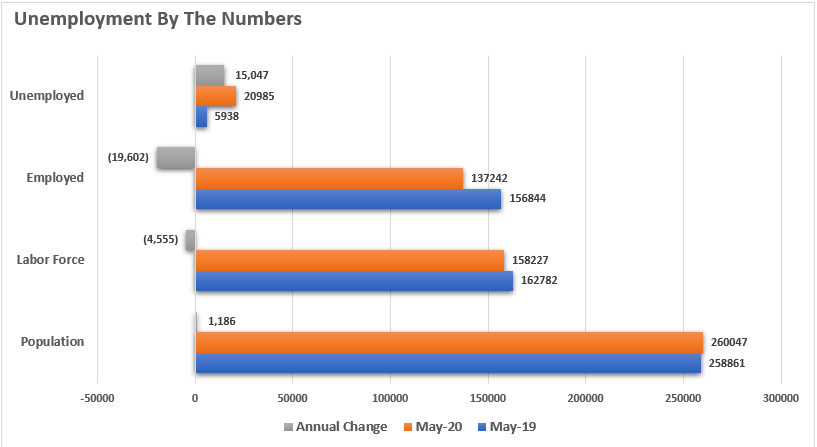
From May 2019 to May 2020:
- The civilian population grew by just 1.186 million. (This is a historically slow growth rate for the population which speaks to the demographic problem.)
- The labor force shrank by 4.555 million. (We assume these people no longer want to work.)
- The number of employed individuals fell by 19.602 million.
- The number of unemployed persons rose by 15,047 million.
Again, these are numbers never before seen in history.
Importantly, the drop in the unemployment rate is due specifically to the substantial drop in the labor force. Since February, 6.3 million people have decided they no longer wanted to work, according to the BLS. Such is substantially more than would be expected even based on the large increase in unemployment.
Therefore, if we adjust for the labor force, and count the extra 4.9 million people who were “not at work for other reasons,” the “realistic unemployment rate” was 17.1 percent in May.
While that number is down from April, it is still higher than any other unemployment rate in over 70 years. (But the 13.3% number was as well.)
BLS Admits Error And Confirms The Math
“There were also a large number of workers who were classified as employed but absent from work. As was the case in March and April, household survey interviewers were instructed to classify employed persons absent from work due to coronavirus-related business closures as unemployed on temporary layoff.
However, not all such workers were so classified.
If the workers who were recorded as employed but absent from work…had been classified as unemployed on temporary layoff, the overall unemployment rate would have been about 3 percentage points higher than reported (on a not seasonally adjusted basis).
In other words, the unemployment rate was 16.3% even using their own data, which suggests the number of unemployed is closer to 26 million.
But this isn’t a new problem suggesting unemployment numbers have been in error for quite some time. To wit from the BLS:
“BLS and the Census Bureau are investigating why this misclassification error continues to occur and are taking additional steps to address the issue. However, according to the usual practice, the data from the household survey are accepted as recorded. To maintain data integrity, no ad hoc actions are taken to reclassify survey responses.”
The Missing Millions
Once we assume this error in counting as been prevalent, understanding the massive gap between the BLS numbers and reality begins to crystallize.
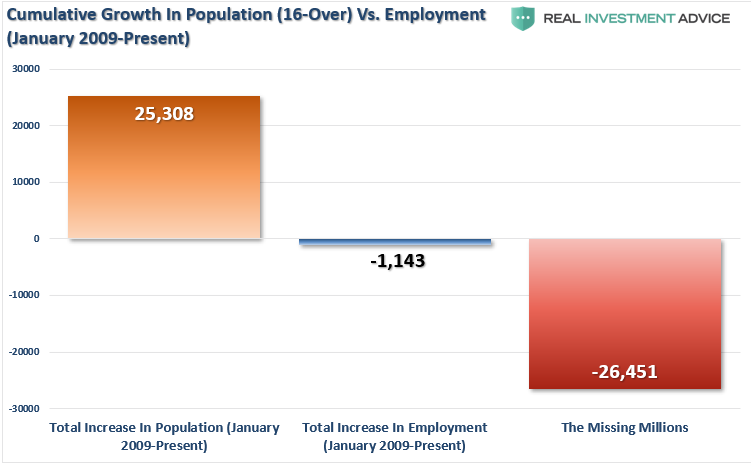
Since the beginning of the last economic expansion, the working-age population has grown by 25.3 million while employment has fallen by 1.14 million through May. As the BLS confirms above, there are over 26 million who are “missing” due to the manner in which employment is calculated.
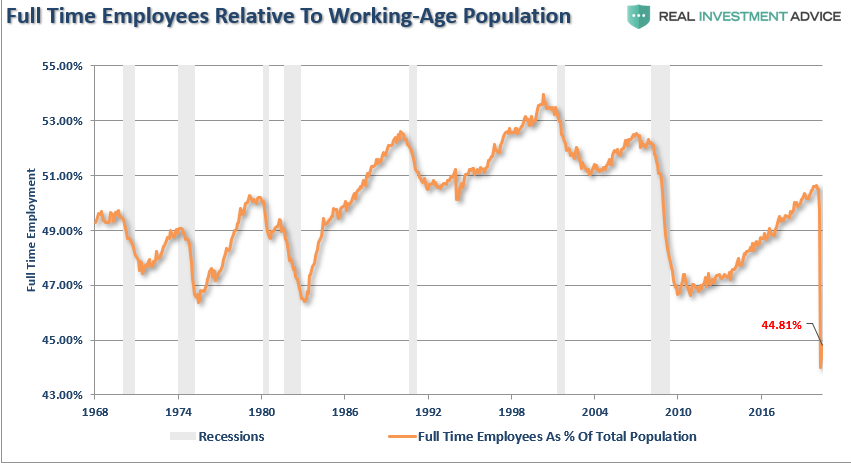
What is crucially important to the economy is full-time employment which is what creates enough income to expand economic growth. The number of full-time employees to the working-age population is at 44.81% which is not high enough to support economic growth.
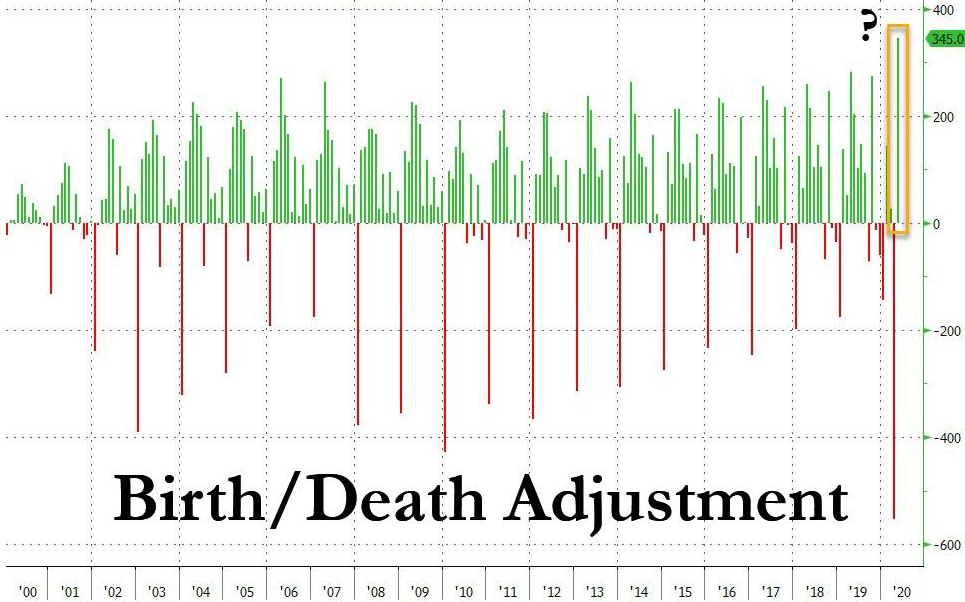
Then, of course, it is also hard to square the BLS claim that a record number (345,000) of small businesses were opened during the month of May when the entire economy was shutdown. The birth/death adjustment is a complete guess by the BLS and heavily flawed. Over the last decade it has added millions of jobs to the employment data even as business creation has fallen.
While the market rallied sharply on Friday due to the “better than expected” number, investors may be getting too far ahead of themselves in the short-term.
The data will be heavily revised over the months ahead, but markets don’t care much about revisions.
What the market does care about, ultimately, is earnings.
Investors Are Too Optimistic
There are several measures of optimism we can look at which have historically corresponded with short-term market peaks and corrections.
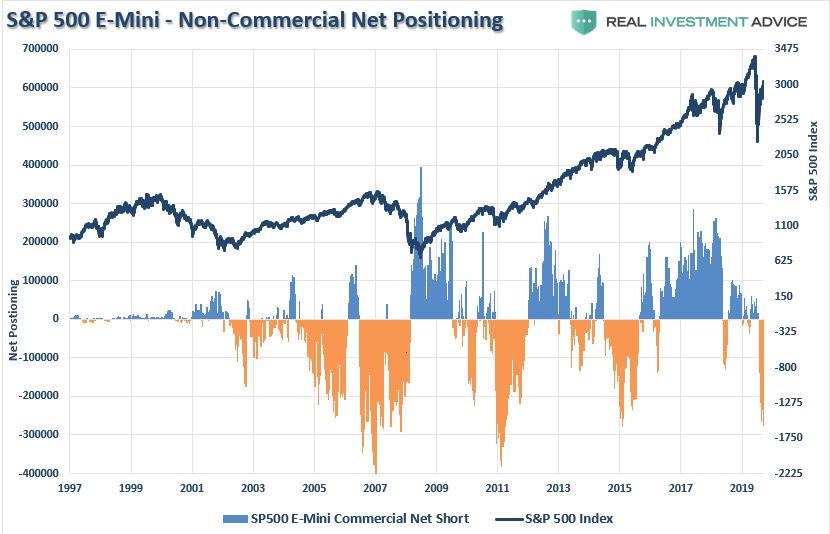
Currently, non-commercial speculators are carrying the one of the largest net-short positions on the S&P 500 in recent history. While such positioning doesn’t necessarily mean the market will crash, it has historically aligned with short-term peaks and bear markets.
The total put-call ratio all suggests similar positioning. With investors getting extremely aggressive by buying call options, the ratio is back to more extreme elevations. The last time the put-call ratio was this elevated was in January.
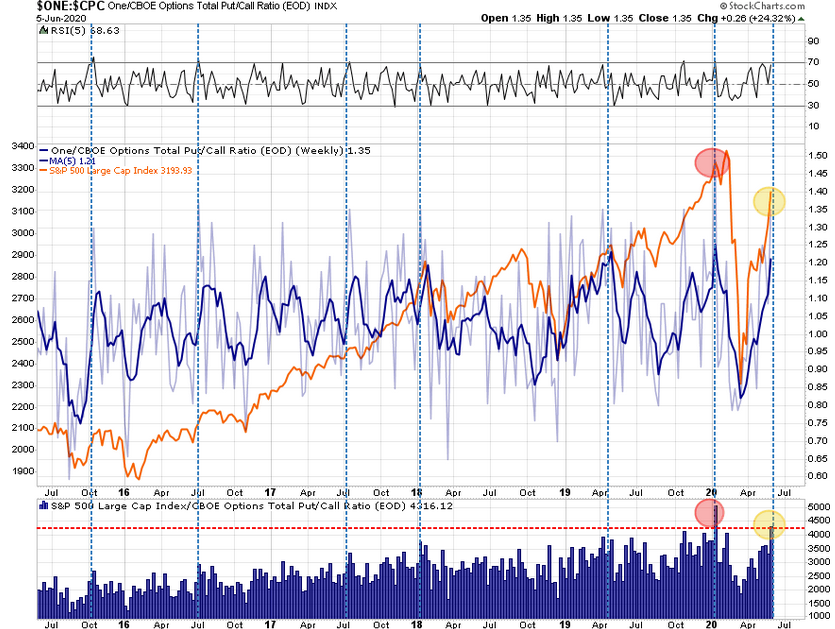
The issue at hand is the markets have priced in a “V-shaped” recovery which is well ahead of what the economic data suggests. Such was seen in Friday’s employment report fiasco.
Technical Review Of The Market
Regardless, the markets are bullish biased and we must be respectful of that reality. As noted in last week’s report:
“No matter how you want to slice the data, the markets are back to more egregious overbought conditions on a short-term basis.”
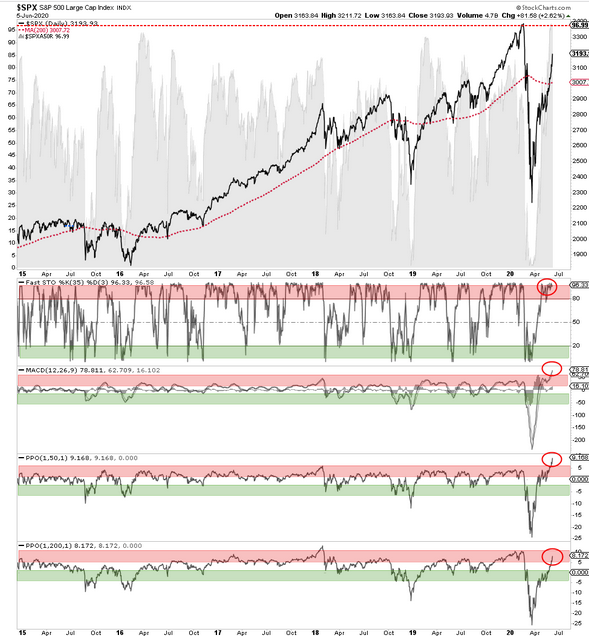
The break above the 200-dma set the bulls in motion and triggered a parabolic advance in the market over the last week. Given the market is now pushing a 3-standard deviation move to the upside, with indicators very overbought, a short-term corrective action is likely. (Note the market was just 3-standard deviations BELOW the 50-dma in March.)
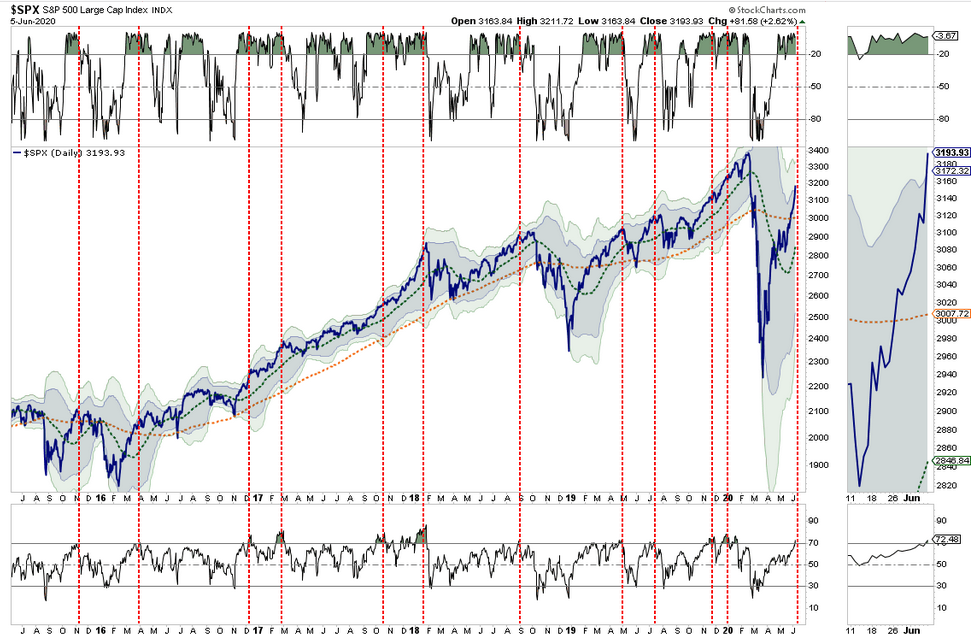
Also, as noted previously, with 95% of stocks now trading above the 50-dma, such has historically signaled short-term corrections to resolve the overbought conditions. Currently, while the market has been rising, the number of stocks above their 50-dma has stalled at one of the highest levels in a decade. Watch for a deterioration in the percentage to signal an upcoming correction.
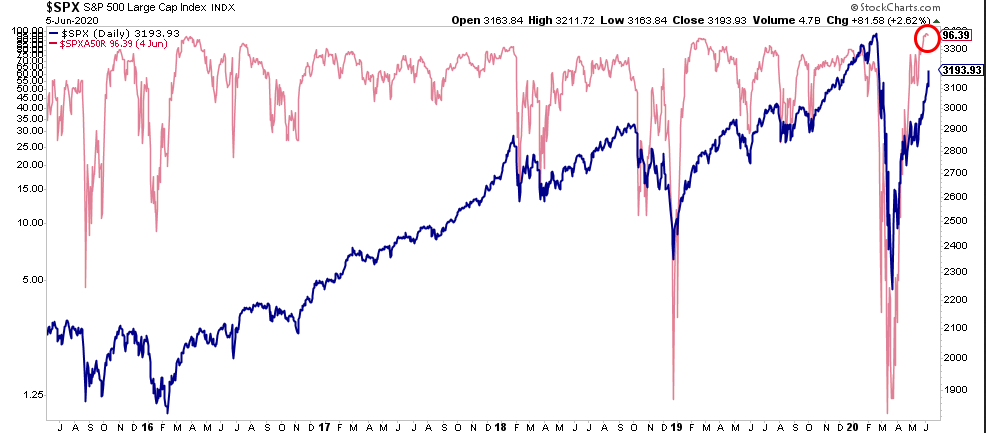
Lastly, all of the overbought/sold indicators have aligned, along with the vast majority of stocks being above the 50-dma. As noted by the red circles below, every measure is in, or exceeding, historical overbought conditions. Such also suggests a correction is likely in the short-term which will provide a better opportunity to increase exposure accordingly.
The Recovery Trade
Lastly, the market has rallied over the past week on “better than expected” economic data which supports hope of a “V-shaped” economic recovery. However, as noted by the Citi Economic Surprise Index, that is likely to change over the next month as data begins to disappoint. Peaks in the surprise index have coincided with short-term corrections, or more, in the market.

With “coronavirus cases” likely to rise sharply following Memorial Day celebrations and recent crowded protests, the risk of disappointment has risen.
This has been an exceptionally rally. All of our equity positions are now extremely stretched and overbought. Conversely, all of our hedges VERY oversold.
Caution is advised.
Updating Risk Ranges
As I wrote previously, the break above the 200-dma had changed the complexion of the market.
“If the markets can break above the 200-dma, and maintain that level, it would suggest the bull market is back in play. Such would change the focus from a retest of previous support to a push back to all-time highs.
While such would be hard to believe, given the economic devastation currently at hand, technically, it would suggest the decline in March was only a ‘correction’ and not the beginning of a ‘bear market.'”
The rally this past week now confirms the selloff in March was a “correction” and not a “bear market.” Such has important considerations in allocation models and portfolio positioning.
In corrections, recoveries back to previous highs are the norm as the bullish trend of the market continues. During bear markets, expect rallies to fail and price trends to change to negative. While it certainly seemed that was the case in March, given the severity of the decline, the rapid recovery has changed the narrative.
However, even as we update the risk/reward trading ranges, the probabilities still remain negative. With the market very overbought short-term (orange indicator in the background), downside risk outweighs the upside return in the short-term.
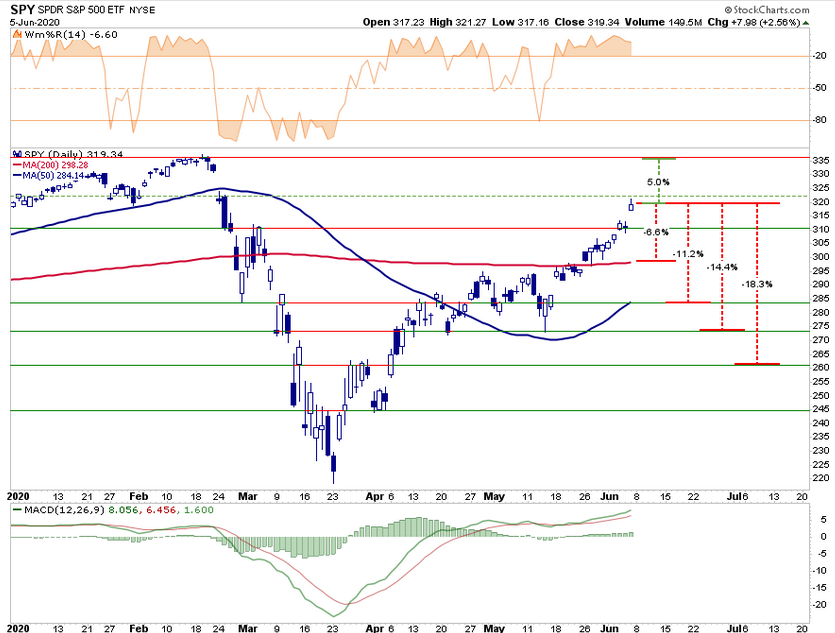
With the S&P 500 (via SPDR S&P 500 (NYSE:SPY)) now only 5% from all-time highs, all measures are now based against that advance. A breakout to all-time highs, should such occur, will reset all parameters. We have assigned probabilities to pullback ranges short-term.
- -6.6% to the 200-dma vs. +5% to all-time highs. Negative (70% probability)
- -11.2% to the 50-dma vs. +5% to all-time highs. Negative (20%)
- -14.4% to previous consolidation lows vs. +5% to all-time highs. Negative (5%)
- -18.3% to March bounce peak vs. +5% to all-time highs. Negative (5%)
Portfolio Positioning For An Overbought Market
While the negative risk/reward dynamics are evident, the more negative outcomes are becoming less probabilistic. However, a deeper correction becomes possible on a longer-term basis, given the deviation in prices from the underlying fundamentals.
I understand if this seems confusing, but it is the difference between chasing markets short-term versus longer-term outcomes for portfolios. This analysis is part of our thought process as we continue to weigh “equity risk” within our portfolios.
As noted last week, the positioning in our portfolios continues to relative to the overall risk we are willing to assume. This past week we continued to make changes in our portfolios by adding to sectors that are positioned to take advantage of the economic recovery.
We continue to add equity exposure in areas that we like, focusing on dividend yield, and continuing to hedge that equity risk with offsetting bond and dollar exposures. (Bonds and the dollar are extremely overseen, so rotation is likely near term, coinciding with a short-term market correction or consolidation)
“In the EQUITY PORTFOLIO, we are adding:
- CVS – 1.5% – With people returning to activity, sales should pick up on the retail side.
- UPS – 1.5% – Economic reopening should see a pick up in shipping rates.
- NSC – 1.5% – Same with transportation.
In the ETF PORTFOLIO we added:
- XLU – 1% addition to current holdings.
- IYT – 3% – Transportation sector to capture an increase in shipping with reopening.
In BOTH PORTFOLIOS, we hedged the increases in equity risk with an addition of 2.5% to TLT, which is currently deeply oversold relative to equities.”
We Like Bonds
The important point is that we are balancing increases in exposure to defensive positioning. In a “risk-off” rotation money will flow into bonds from equities, which will shield the portfolio from a decline. Given bonds are deeply oversold, versus a grossly overbought market, that rotation is likely coming sooner rather than later.
(As opposed to the S&P 500, bonds are more than 3-standard deviations oversold and on Friday began a reversal rally. We recently added to our positions to take advantage of a risk rotation.)
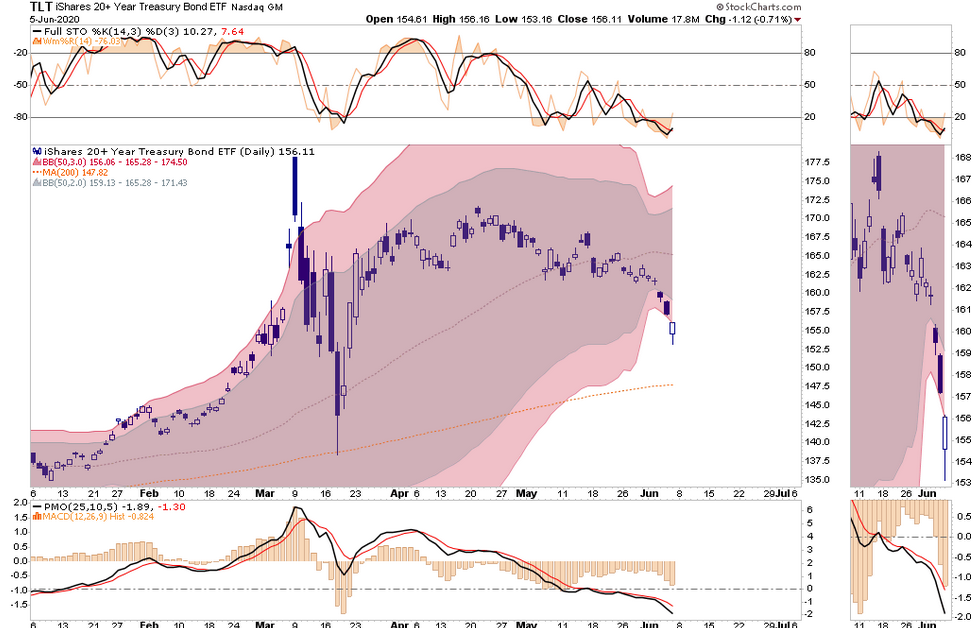
Obviously, we don’t care for the risk/reward of the market currently. As such, we suspect a better opportunity to increase equity risk will come later this summer.
Winning The War
I want to conclude with this quote from our MacroView this week:
“Our goal is to win a war, and we may need to lose a few battles in the interim.
Yes, we want to make money, but it is even more important not to lose it. If the market continues to mount even higher, we will likely lag. The stocks we own will become fully valued, and we’ll sell them. If our cash balances continue to rise, then they will. We are not going to sacrifice our standards and thus let our portfolio be a byproduct of forced or irrational decisions.
We are willing to lose a few battles, but those losses will be necessary to win the war. Timing the market is an impossible endeavor. We don’t know anyone who has done it successfully on a consistent and repeated basis. In the short run, stock market movements are completely random – as random as you’re trying to guess the next card at the blackjack table.” – Vitaliy Katsenelson
I agree, and while such may be the case for the moment, markets like this have a nasty habit of delivering unpleasant surprises. We are in this to win the “war.”
But I will be honest; I don’t like losing battles even for the best of reasons.
