Technically Speaking For The Week Of February 11-15
Summary
- Spain is now experiencing political and economic problems.
- We're starting to see some weakness in Asian data. Japanese industrial production dropped sharply and South Korean unemployment jumped higher.
- The markets ended the week on a solid note.
We can now add Spain to the list of EU countries grappling with political and economic upheaval. The Prime Minister has called for a snap election in April after suffering a major parliamentary defeat this week. This has been building for some time; since 2016, no party has been able to claim a large enough majority to form a government. In addition, the Spanish middle class is shrinking for a number of the same reasons that the same trend is occurring in other advanced economies:
Since the recession of the late 2000s, the middle class has shrunk in over two-thirds of the European Union, echoing a similar decline in the United States and reversing two decades of expansion. While middle-class households are more prevalent in Europe than in the United States — around 60 percent, compared with just over 50 percent in America — they face unprecedented levels of vulnerability.
A number of factors are contributing to this problem: rising automation, the international competition for labor, the rise of the gig economy, and the growing trend toward monopsony.
We're now seeing some concerning data from non-China Asia. Japanese industrial production dropped 1.9% Y/Y in the latest report. More importantly, it has contracted in three of the last seven months: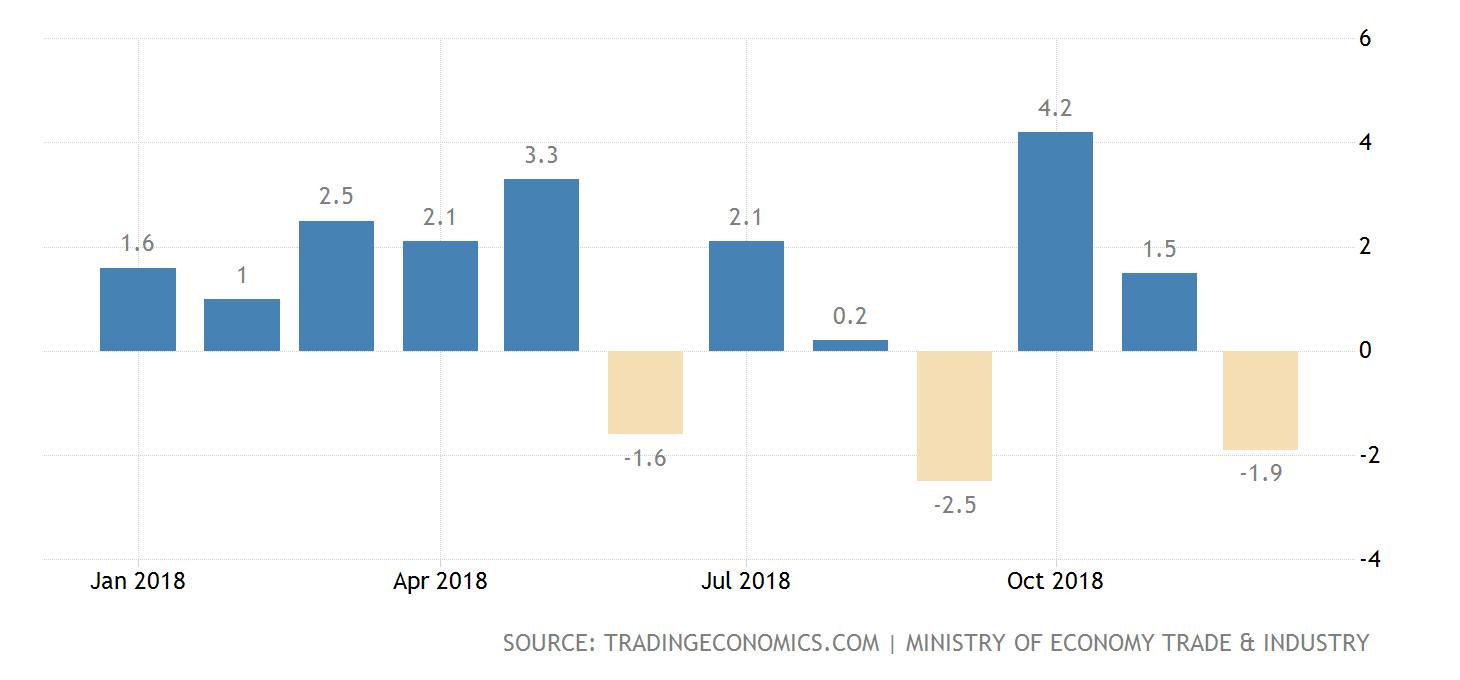
And the South Korean unemployment rate jumped to 4.4% in the latest report: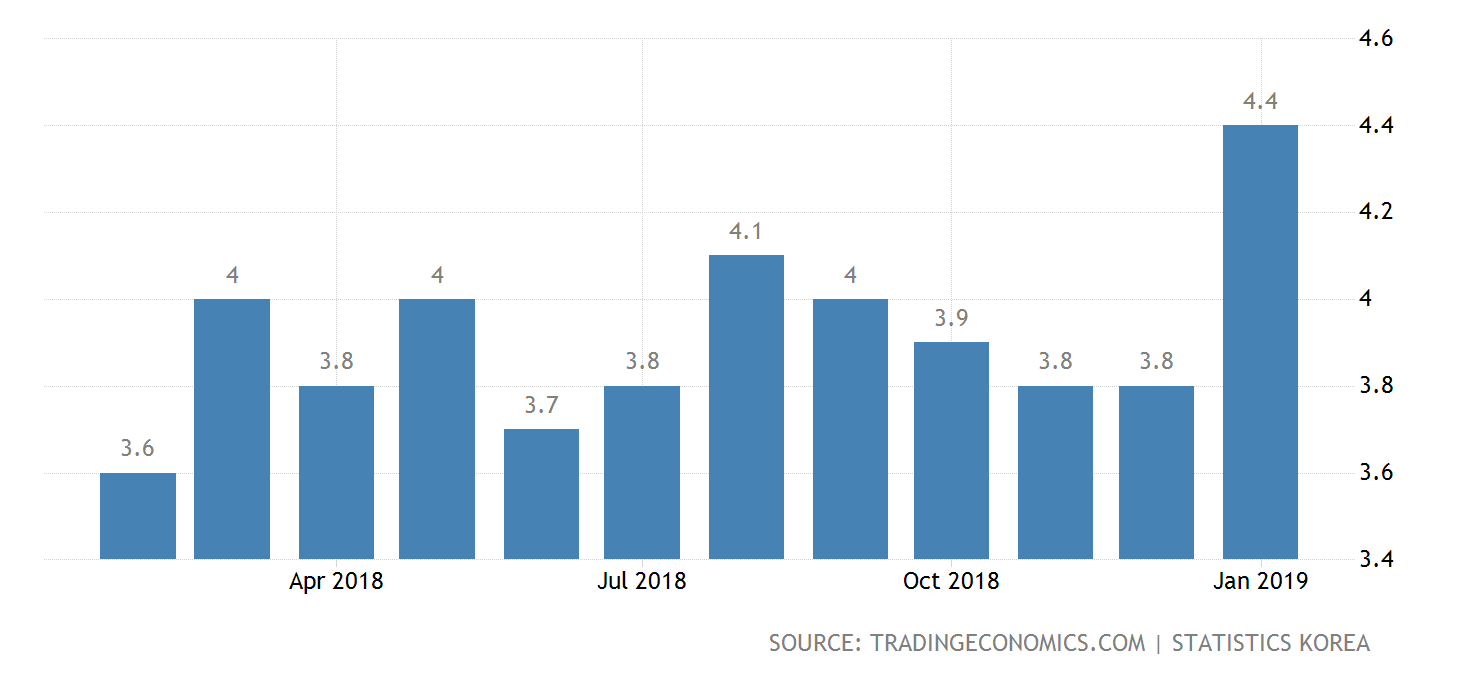
This has been trending higher for the last year. It was between 3.8%-4% for 2018.
The dovish trend among Fed Presidents continues. From the WSJ (emphasis added):
Kansas City Federal Reserve President Esther George, one of the central bank’s most reliable advocates for raising interest rates in recent years, said the Fed could refrain from more increases for the time being while it studies the effects of its previous steps to withdraw economic stimulus.
Cleveland President Mester (emphasis added):
Since December 2015, when the expansion was well underway, the FOMC has been gradually moving the policy rate up from the extraordinarily low level that was needed to address the Great Recession. At its January meeting, the FOMC decided to keep the target range for the federal funds rate, our policy rate, at 2-1/4 to 2-1/2 percent, and we have adopted a wait-and-see approach regarding future rate adjustments. I fully supported this decision because I believe that policy, for the time being, is well-calibrated to the economic outlook and the risks around that outlook.
Since the first of the year, there has been a unanimous change in the Fed's tone to dovish or "wait and see."
The markets had a good day. The Dow was up 1.6% while the Russell 2000 rose 1.58%. Mid-caps rounded out the top three by increasing 1.19%. Financials were the best performing sector, gaining slightly more than 2%; energy and health care rounded out the top three be advancing 1.58% and 1.48%, respectively. The indexes did well for the week: the Russell gained 4.2%, with the mid-caps moving 3.39% higher. The S&P was up about 2.5%.
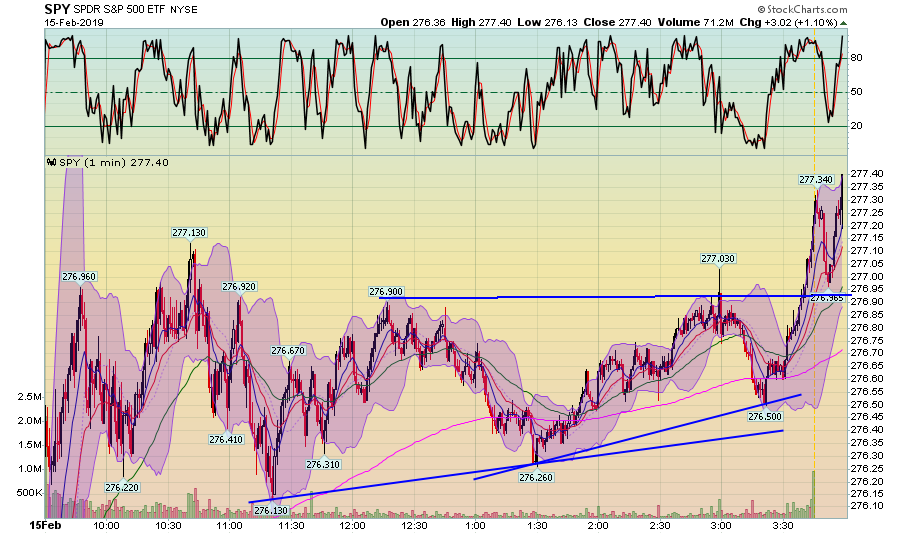
Let's turn to the charts, starting with today's SPY:
The SPY gapped higher at the open then consolidated for most of the day. Prices formed a rising bottom pattern until they broke through resistance in the last half-hour of trading and ended the session at a daily high.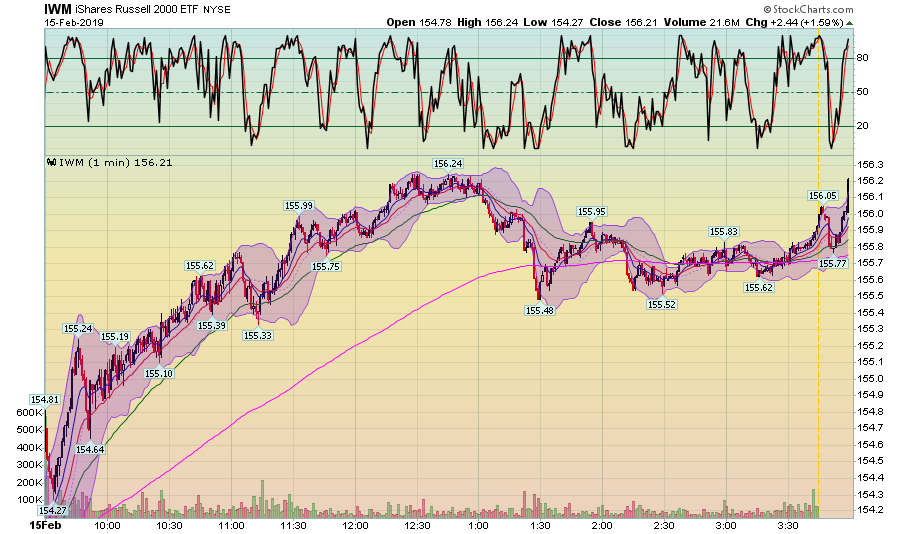
The IWM had a better day, rallying until right after lunch before falling to the 200-minute EMA. Like the SPYs, prices spiked at the close.
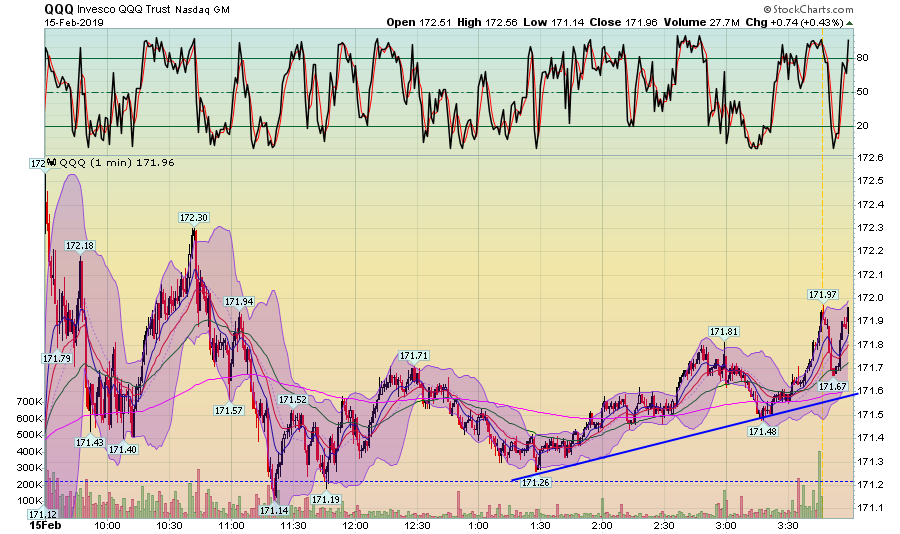
The Nasdaq stands in contrast. It gapped at the open but then fell to its previous closing price, using that level for support through the early afternoon. There's a modest uptrend for the last few hours of trading, but prices closed about halfway between the previous days close and today's high
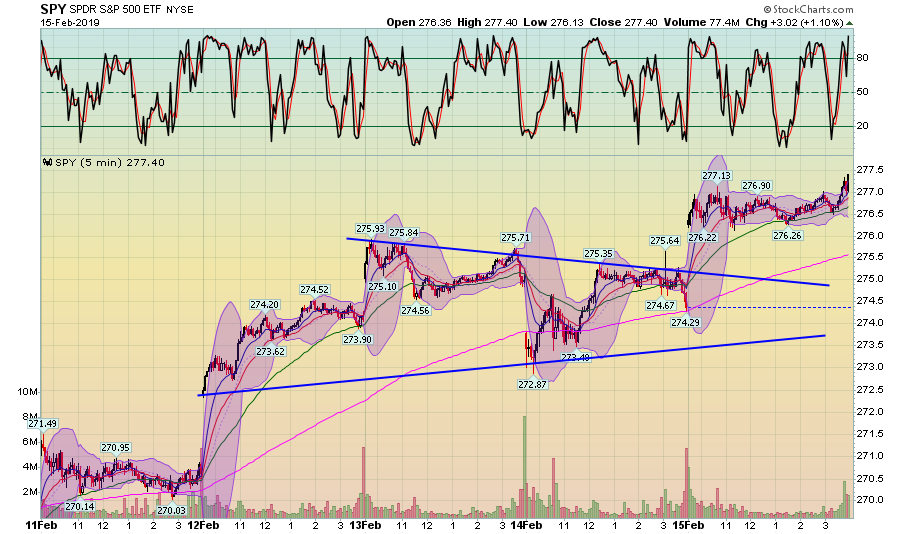
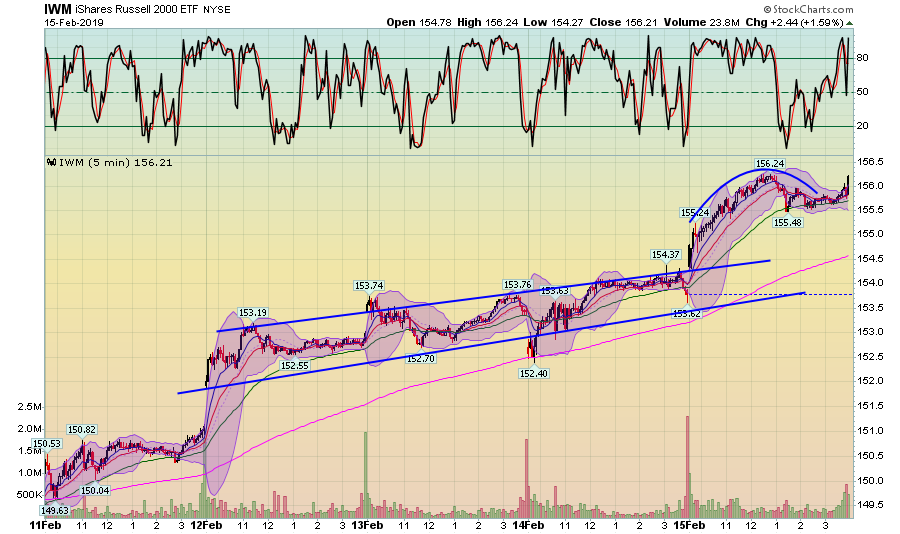
For the week, the SPY has two gaps higher -- one on Tuesday and one on Thursday with a triangle consolidation on Tuesday-Thursday. There are some intra-day prices gains on Tuesday and Thursday (the latter only after a gap lower at the open) but for the most part, gains occurred between trading sessions at the open.
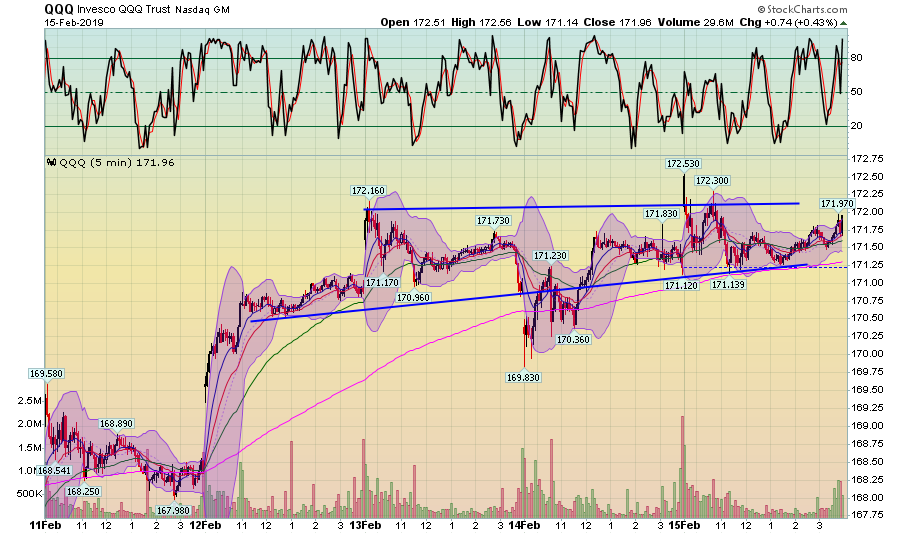
For the QQQ, we have a decidedly different story. This index made most of its gains by Wednesday morning. Prices consolidated from Wednesday morning through the close on Friday.
And then there's the IWM, which formed an upward sloping pattern during the middle of the week before gapping higher at the open on Friday, rallying and then closing near its weekly high.
Overall, we're ending the week on a good note. The three major indexes are higher and the 5-day charts are pretty positive.
Disclosure: I/we have no positions in any stocks mentioned, and no plans to initiate any positions within the next 72 hours. I wrote this article myself, and it expresses my own opinions. I am not receiving compensation for it (other than from Seeking Alpha). I have no business relationship with any company whose stock is mentioned in this article.

