Technically Speaking For April 23
So - what can we expect from Friday's GDP report? James Picerno offers this report:
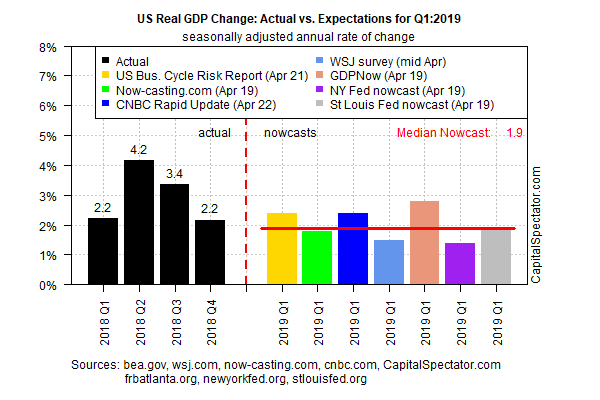
The Atlanta Fed's tracker has increased from below 0.5% to its current reading of 2.8% while the NY Fed's number has decreased from 2.3% to 1.37%. This just shows how different models arrive at different conclusions. According to the Atlanta Fed's data, the range of Blue Chip forecasts ranges from 0.7% to 2%. Remember the following data:
- Consumer: Unemployment is low, incomes are rising, confidence has rebounded a bit, and retail sales have rebounded.
- Business: Durable goods orders have moderated, ISM numbers show expansion, profits are near cycle highs, business sentiment is mixed, investment is fair.
- Housing: overall is softer but not crashing. We're seeing the effect of rising interest rates on demand.
- International: China may have stabilized; the EU is still weaker; EMs are modestly softer but their weakness has so far been contained.
Finally, remember that first quarter US GDP has been notoriously weak for the duration of this expansion, meaning you shouldn't freak out if the number is weak.
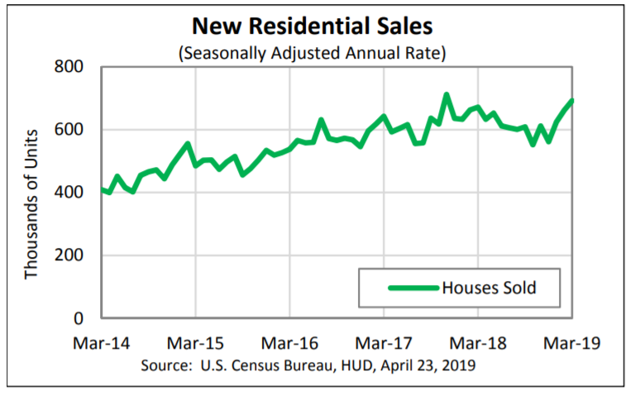
Mixed data on the housing market. Yesterday, the NAR reported that existing home sales declined 4.9% in the latest month and are off 5.4% Y/Y. Existing sales comprise over 90% of the home sales market. In contrast, new home sales rose 4.5% M/M and 3% Y/Y. They are now near their high for this expansion:
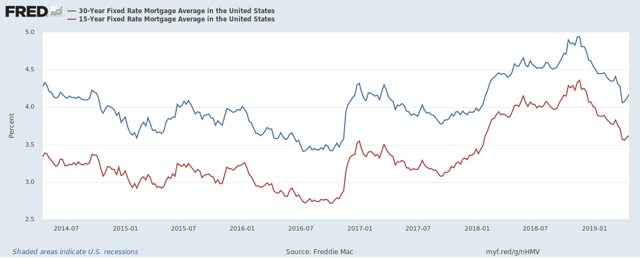
The housing market has been understandably soft due to the Fed's interest rate increases. However, 15 and 30-year mortgage rates have been declining since the end of last year:
Lower rates should help to spur demand as the summer buying season heats up.
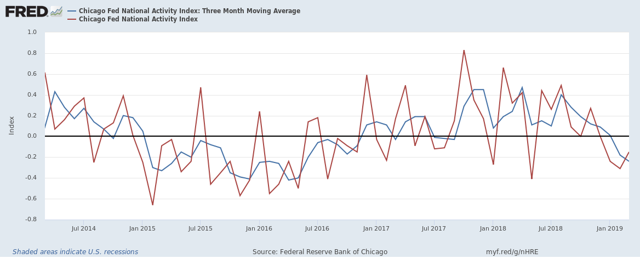
The Chicago Fed released its National Activity Index on Monday. Here's a chart of the data.
The red line is the monthly figure while the blue line is the three-month moving average. Readings below 0 indicate growth below trend.
Here is my basic market thesis:
The markets are "toppy"; the rally in the Treasury market and large-cap equity indexes and underperformance of the smaller-caps indicates traders are projecting weaker growth. For my thesis to change, I need a Treasury market selloff and/or a stronger small-cap performance.
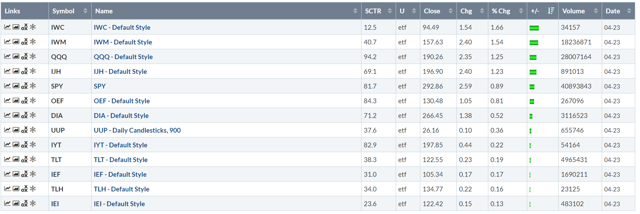
Finally, we have a rally in the micro and small-caps:
The micro-caps led the market higher, rallying 1.66%. The small-caps were the second-best performer followed by the NASDAQ and mid-caps. While Treasuries were at the "bottom of the pack," they were still up modestly on the day.
Let's start with a daily chart:
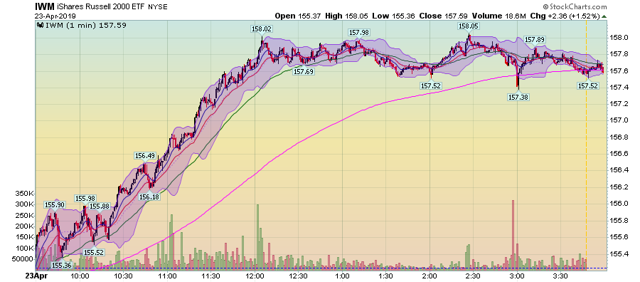
There are two trends in today's chart. First, prices started to rally at about 10:15 and continued to move higher until lunch. Second, prices moved sideways for the remainder of the trading session. This is a good development; it means that traders were comfortable not taking profits. Overnight, at least, they're bullish.
The main issue now is the daily charts for the mid, small, and micro-caps. Let's take them in that order:
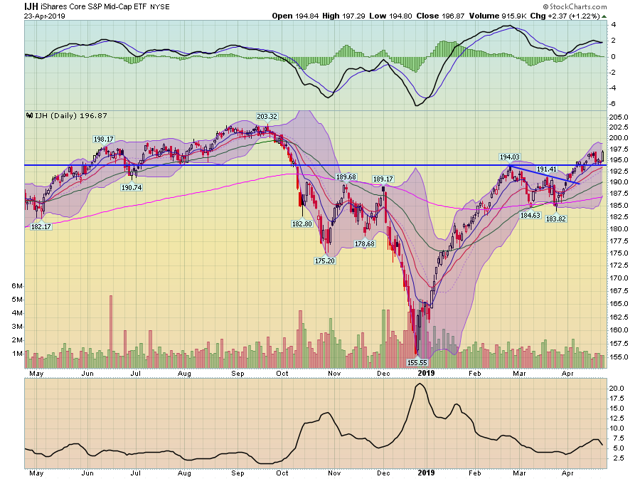
The mid-cap chart is strong. Prices are above the 194 level, which was the high from the Spring rally. Today, prices printed a solid, bullish candle and are just over the recent high around 197.5. The chart's main bearish element is the MACD.
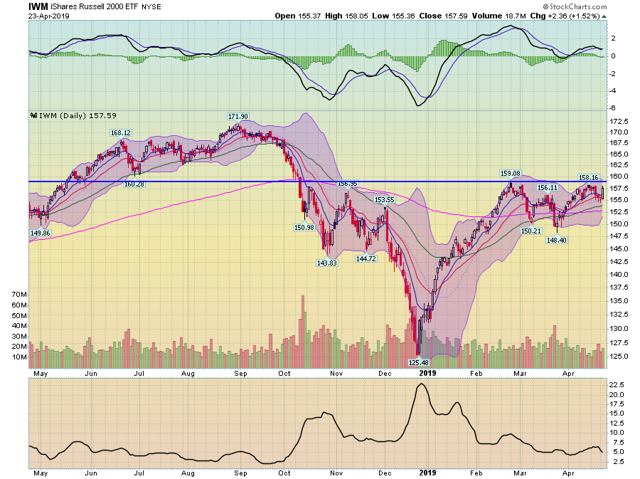
The small-caps remain below recent highs of 159 and have negative momentum. However, today was a very nice candle print.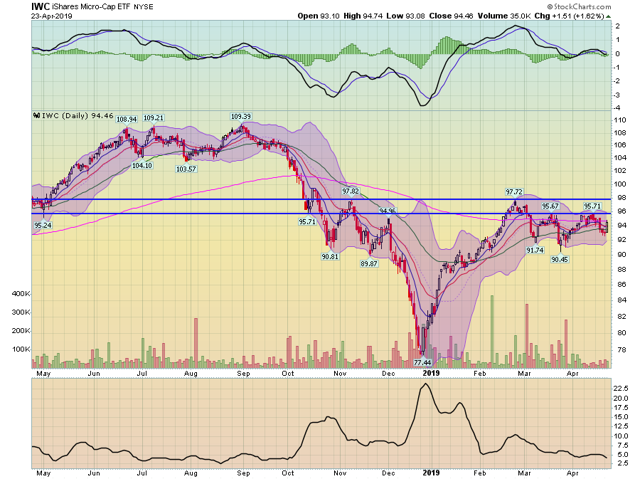
The micro-caps remain below two recent highs and have negative momentum. But today's rally may provide prices with enough strength to continue higher tomorrow.
Today's market was pushed higher by solid earnings news from major companies and a very strong new home sales print. Let's hope that the earnings news continues tomorrow, which will provide the bulls with more fodder to move higher.
Disclosure: I/we have no positions in any stocks mentioned, and no plans to initiate any positions within the next 72 hours. I wrote this article myself, and it expresses my own opinions. I am not receiving compensation for it (other than from Seeking Alpha). I have no business relationship with any company whose stock is mentioned in this article.

