Last week, we started into an exploration of various technical indicators with “What Exactly Is RSI.”. This week, I want to continue our exploration into the signals that we most often discuss in our “Technically Speaking” posts and in our weekly Real Investment Reports.
As I wrote, technical analysis is often dismissed by investors for three reasons:
- A lack of understanding of exactly what technical analysis is,
- An inability to properly apply technical analysis to portfolio management, and;
- The media narrative that “technical analysis” doesn’t work.
There is no “one method” of technical analysis that works for everyone. Every technician uses different methods, indicators, and time-frames for their own analysis. Much depends on your personal investment time frame, risk tolerance and investing behavior.
This article is the second in the series to discuss some of the more common technical indicators we use in our own portfolio management practice and how we apply them.
Today, we will continue our journey with the standard-deviation as measured with “Bollinger Bands,” and “reversions to the mean.”
For Every Buyer, There Is A Seller
I am often asked that since there is “always a buyer for every seller,” then how can a market become overbought?
Before we get into the raw technical analysis of showing the “overbought” condition let’s rationalize what one is and how it occurs.
While it is true there is a buyer and seller in every transaction, it is the “supply and demand” of those participants which determines the price. Let me explain.
Imagine two rooms of 100 individuals each that want to buy shares of ABC stock. Room A has 100 individuals that currently own ABC stock and Room B has 100 individuals with cash wanting to buy shares of ABC. The table below shows a very simplified model of this process.
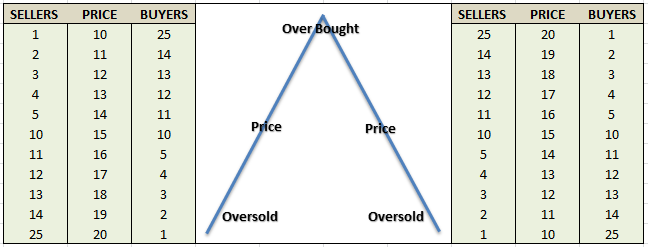
At $10 a share, there are numerous buyers but sellers are few. The demand for the shares drives the price higher which entices more sellers. As long as the demand for shares outpaces the supply of sellers – the price is pushed higher. However, at some point, the price reaches a level that exhausts the supply of buyers. The next price decline occurs as sellers have to begin lowering prices to find buyers.
So, “Yes”, for every buyer there is a seller, but the question is always at “what price?” Since price is determined by the “supply/demand imbalance,” it is only logical that by using historical prices investors can determine what “price” buyers and sellers have previously been most active. Hence, the determination of both “overbought” or “oversold” conditions.
The important point, from a money management standpoint, is the determination of the potential risk/reward opportunity for allocating, or extracting, investment capital at any given time.
As a portfolio manager, clients tend “not to like” having their capital invested in the markets only to almost immediately suffer a principal loss. By using some measures to determine the current risk/reward outcome, the deployment of capital can be more effectively managed.
Market Extensions & Reversions To The Mean
Now that we have defined what overbought means – I can explain what I mean by overextended. As I discussed in “Revisiting Bob Farrell’s 10 Investing Rules”:
“Like a rubber band that has been stretched too far – it must be relaxed in order to be stretched again. This is exactly the same for stock prices that are anchored to their moving averages. Trends that get overextended in one direction, or another, always return to their long-term average. Even during a strong uptrend or strong downtrend, prices often move back (revert) to a long-term moving average.”
The chart below shows the S&P 500 with a 52-week simple moving average. The bottom chart shows the percentage deviation of the current price of the market from the 52-week moving average. During bullish trending markets, there are regular reversions to the mean that create buying opportunities. However, what is often not stated is that in order to take advantage of such buying opportunities profits should have been taken out of portfolios as deviations from the mean reached historical extremes. Conversely, in bearish trending markets, such reversions from extreme deviations should be used to sell stocks, raise cash and reduce portfolio risk rather than “panic sell” at market bottoms.
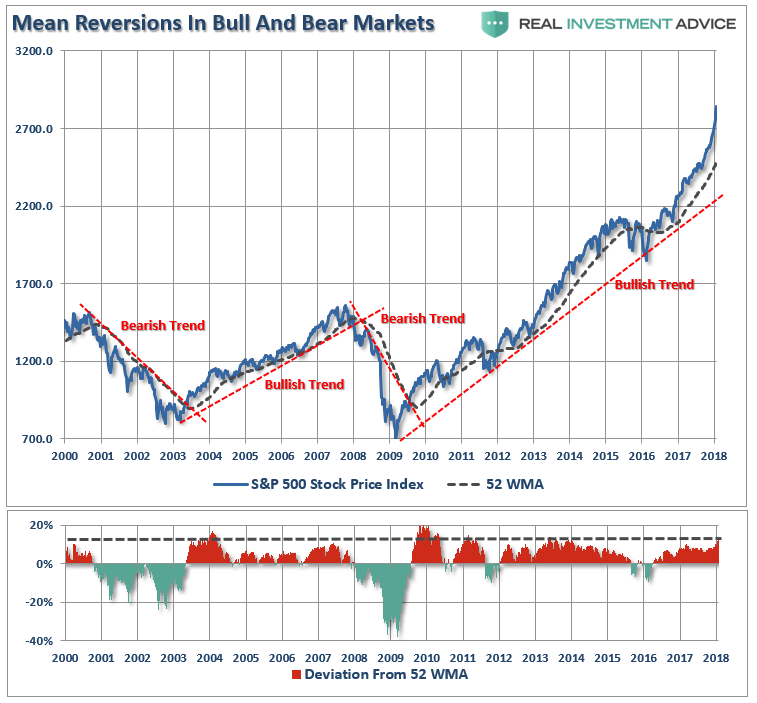
The dashed red lines denote when the market changed trends from positive to negative. Understanding, and identifying, when markets change trend is the very essence of portfolio “risk” management.
The idea of “stretching the rubber band” can be measured in several ways, but I will limit our discussion this week to Standard Deviation and measuring deviation with “Bollinger Bands.”
“Standard Deviation” is defined as:
“A measure of the dispersion of a set of data from its mean. The more spread apart the data, the higher the deviation. Standard deviation is calculated as the square root of the variance.”
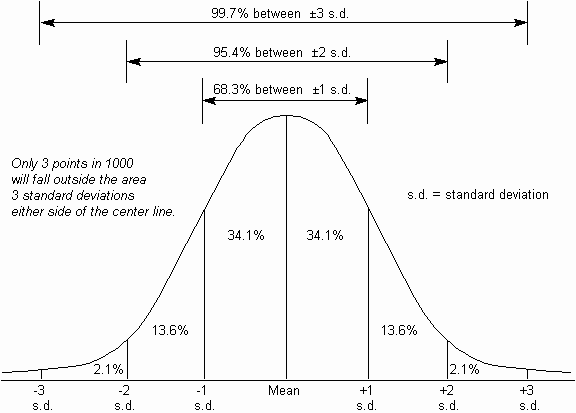
In plain English this means, and as shown in the chart below, is that the further away from the average that an event occurs the more unlikely it becomes. As shown below, out of 1000 occurrences, only three will fall outside of the area of 3 standard deviations. 95.4% of the time events will occur within two standard deviations.
For the stock market, and as shown in both charts above, the standard deviation is measured is with Bollinger Bands. John Bollinger, a famous technical trader, applied the theory of standard deviation to the financial markets.
Because standard deviation is a measure of volatility, Bollinger created a set of bands that would adjust themselves to the current market conditions. When the markets become more volatile, the bands widen (move further away from the average), and during less volatile periods, the bands contract (move closer to the average).
The math is pretty straight-forward as shown in the table below. (The only difference between 2, 3 or 4 standard deviations from the mean is the multiplication factor at the end of the formula)
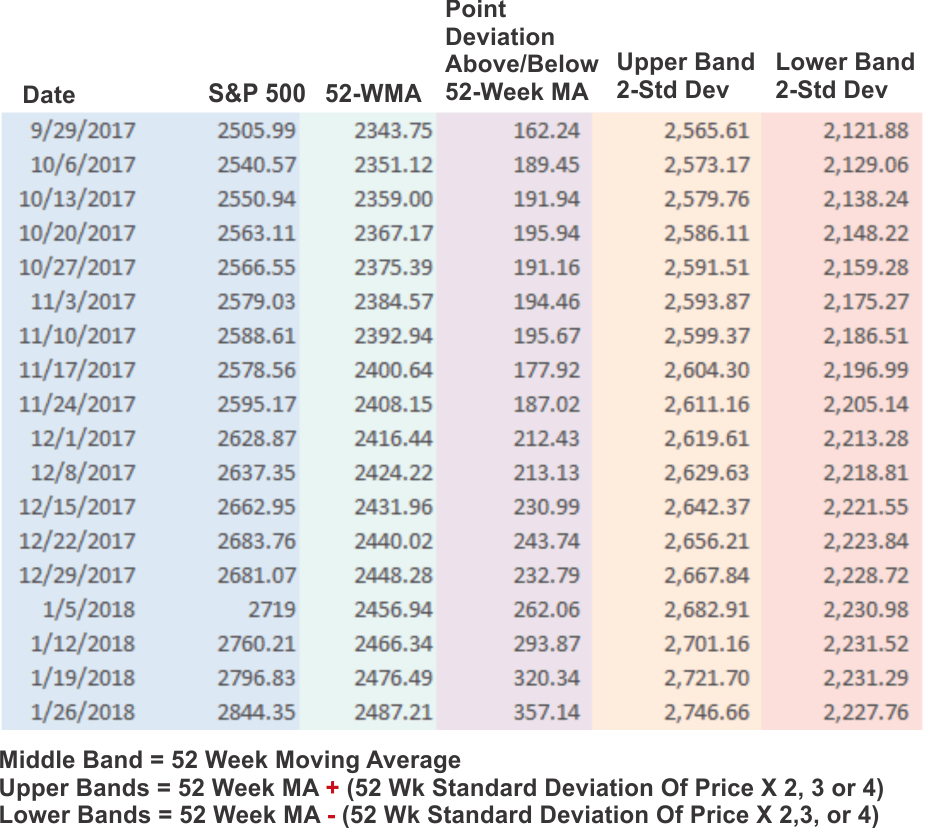
This can be calculated in Excel by using the STDEVPA formula as follows:
=Current 52-Week MA level +/- (STDEVPA(52-week range of S&P 500 prices) * 2, 3 or 4)
The following chart illustrates the output.
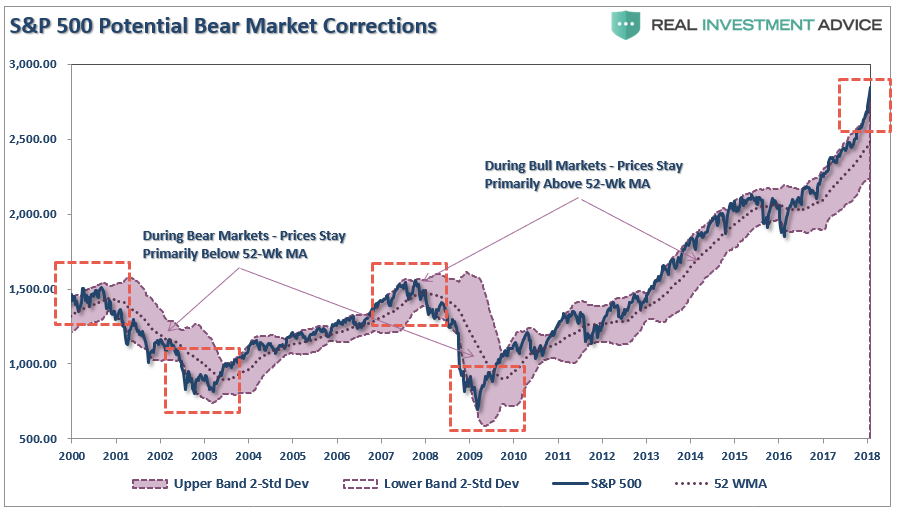
The dashed purple line is the 52-week (1-year) moving average (or mean) with the shaded area representing 2-standard deviations. As shown in the chart above, 2-standard deviations encompass 95.4% of all probable price movement. Even during the 2012-15, QE3 driven, stock advance, there were several corrections back to the 52-week moving average, or further, which allowed for increases in equity risk within the ongoing bull market advance.
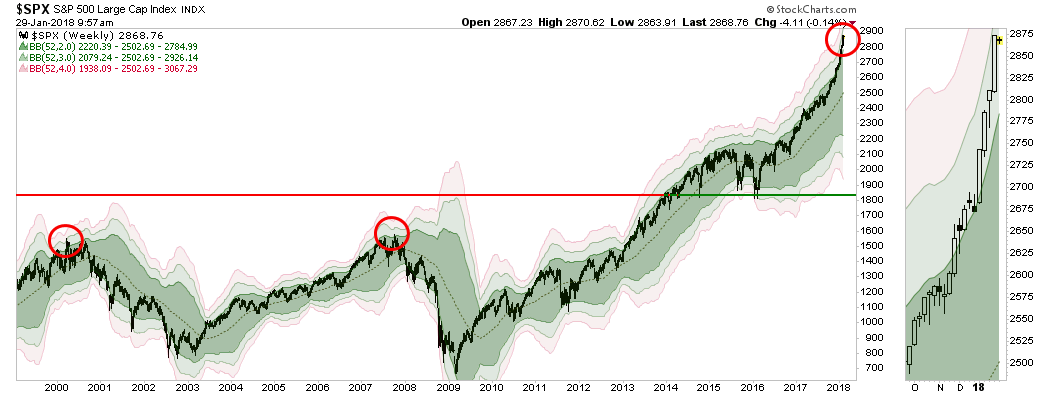
However, currently, the market is pushing towards 4-standard deviations (99.9 percentile) above the 52-week mean. As shown below, this is “rarefied air” for the market historically.
The next chart shows this more clearly. Currently, the deviation above the 52-week moving average is at levels not seen previously going back to 1981. Previously, large deviations from a long-term mean have coincided with mild to severe market corrections and crashes. Given the current extreme deviation, one can only assume a negative outcome in the future.
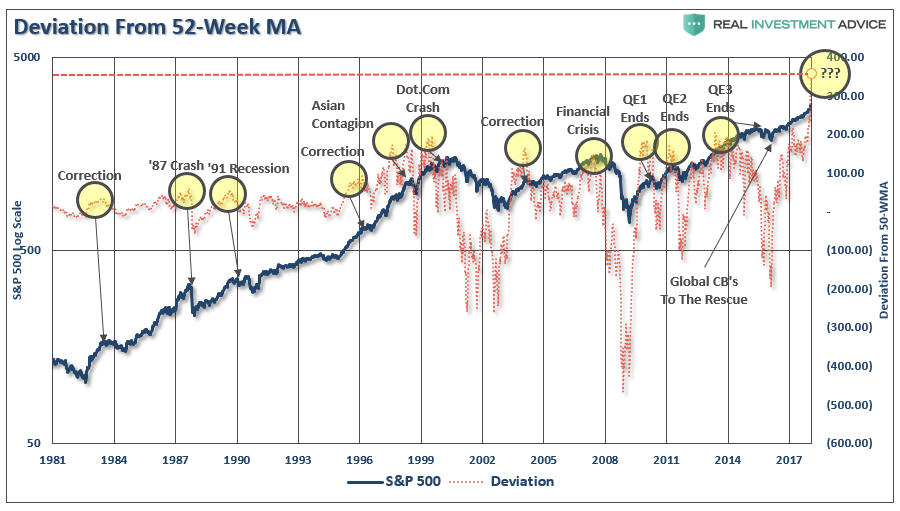
Over the next several weeks, or even months, the markets can certainly extend the current deviations from long-term mean even further. But that is the nature of every bull market peak, and bubble, throughout history as the seeming impervious advance lures the last of the stock market “holdouts” back into the markets.
As Vitaliy Katsenelson once wrote:
“Our goal is to win a war, and to do that we may need to lose a few battles in the interim. Yes, we want to make money, but it is even more important not to lose it.”
I wholeheartedly agree with that statement which is why we remain invested, but hedged, within our portfolios currently. Unfortunately, for most investors, they have very little understanding of the dynamics of markets and how prices are “ultimately bound by the laws of physics.” While prices can certainly seem to defy the law of gravity in the short-term, the subsequent reversion from extremes has repeatedly led to catastrophic losses for investors who disregard the risk.
With sentiment currently at very high levels, combined with low volatility and excess margin debt, all the ingredients necessary for a sharp market reversion are currently present.
As I noted last week, technical analysis IS NOT some “black box” approach to portfolio management. However, what technical analysis does provide is a method to extract “emotion” from the “buy/sell” process. For us, the fundamentals dictate WHAT we “buy” and “sell” in portfolios, but it is the technicals that drive the WHEN those decisions are implemented. Remaining fully invested in the financial markets without a thorough understanding of your “risk exposure” will likely not have the desired end result you have been promised.
(Follow up read on how to approach the market: The 80/20 Rule Of Investing)
Just remember, in the market there really isn’t such a thing as “bulls” or “bears.” There are only those that “succeed” in reaching their investing goals and those that “fail.”
