A recent Bloomberg article made the case that since 2009 “sell signals” are useless during “mania” markets. To wit:
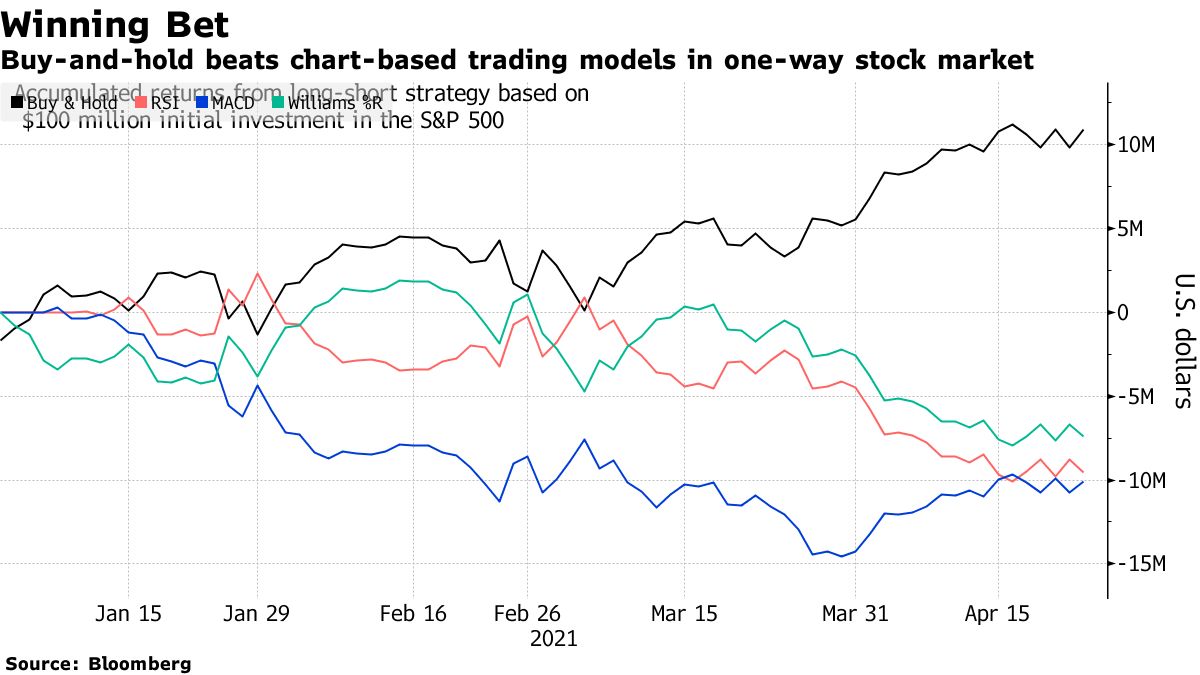
“If you bailed because of Bollinger® Bands, ran away from relative strength or took direction from the directional market indicator in 2021, you paid for it.
It’s testament to the straight-up trajectory of stocks that virtually all signals that told investors to do anything but buy have done them a disservice this year. In fact, when applied to the S&P 500, 15 of 22 chart-based indicators tracked by Bloomberg have actually lost money, back-testing data show. And all are doing worse than a simple buy-and-hold strategy, which is up 11%.” – Bloomberg
Note: “Bloomberg’s back-testing model purchases the S&P 500 when an indicator signals a ‘buy’ and holds it until the system generates a ‘sell.’ The index gets sold, and a short position established, until a buy is triggered.”
See, you should “buy and hold” invest, right?
Investing Based On Hindsight
Bloomberg goes on to clarify essential points.
“Of course, few investors employ technical studies in isolation, and even when they do, they rarely rely on a single charting technique to inform decisions. But if anything, the exercise is a reminder of the futility of calling a market top in a year when the journey has basically been a one-way trip.”
In the short term, which can even include a 12-year bull market cycle, there are periods where “buy and hold” investing outperforms any other form of asset management. The problem is that you only know for sure that “buy and hold” was the proper strategy in hindsight.
Most only have a limited amount of time to invest for retirement for investors, so “getting it right” largely depends on two factors.
- When you start your investing process; and
- Avoiding major drawdowns
With the vast amount of individuals already vastly under-saved, the current “bear market” cycle will reveal the full extent of the “retirement crisis” silently lurking in the shadows. The Fed, Government bailouts, and low interest rates can’t fix this problem.
Such isn’t just about the “baby boomers,” either. Millennials are haunted by the same problems as their prospects of “economic prosperity” get set back years. But here is the real problem for “baby boomers.”
Crashes Matter
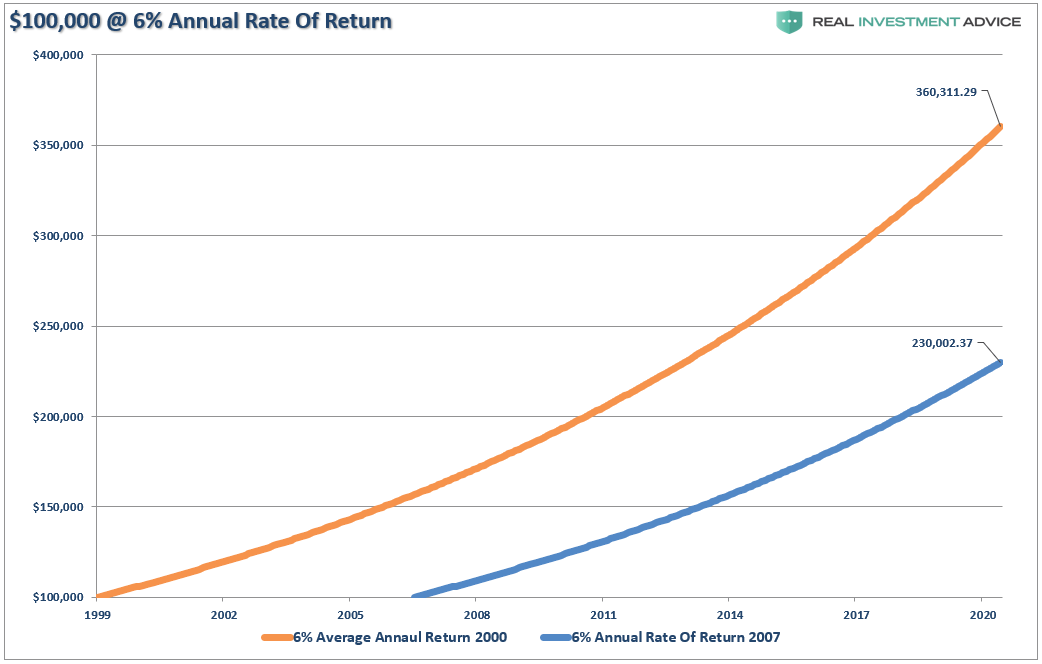
Financial advisors regularly tell clients that the market grew 6% annually since 1900. Therefore, that is what returns will be in the future. The chart below shows $100,000 invested at 6% annually from 2000 or 2007.
Unfortunately, it didn’t work out that way.
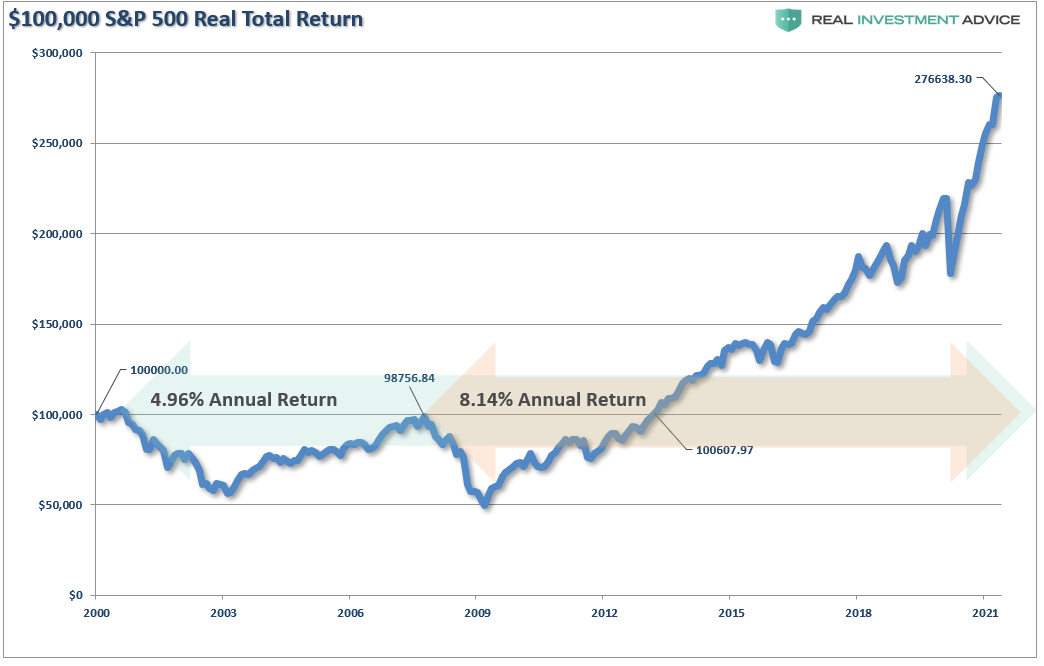
During the past 20-years, the annual return for stocks has been just 4.96% annualized. Since the peak of 2007, returns have annualized roughly 8.14%. Over the next decade, current valuations suggest average returns will return to 2% or less.
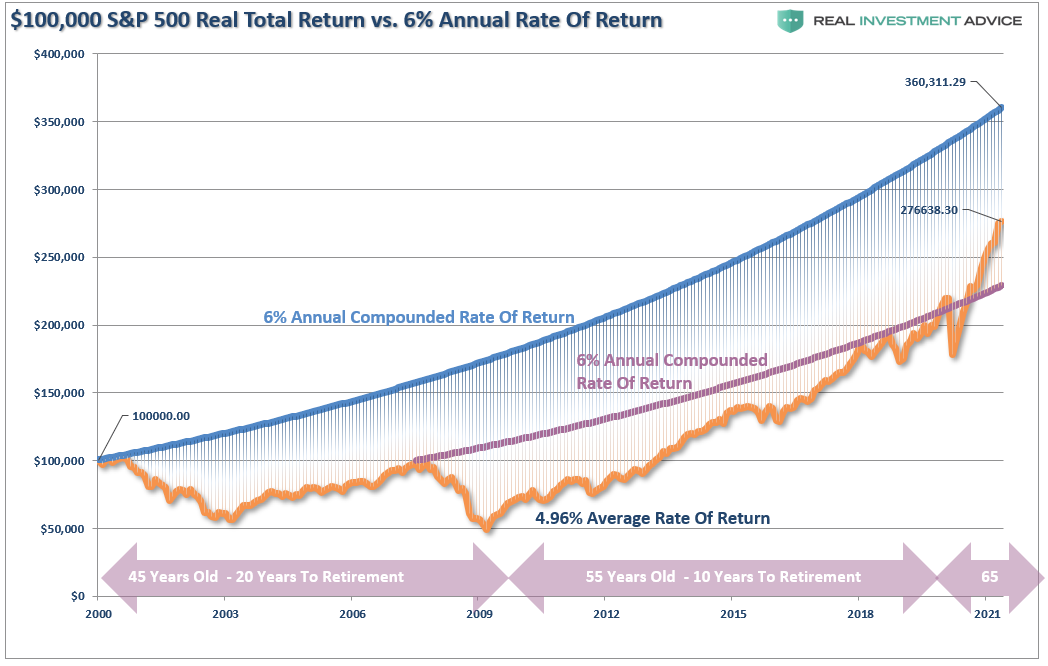
For boomers who start in 2000, whose financial plans assume high return rates to offset a savings shortfall, they are now well short of their retirement goals. For those who started in 2007, they finally got back on track this year. The question is can they keep it?
Unfortunately, investment returns are far worse, as a vast majority of fully-invested individuals in 2007 liquidated out of the market by the end of 2008. It took years before they returned to the market. As such, actual returns are vastly different than what the index suggests.
Here is the sequence of events by age:
- 30’s: In 1980, the “baby boomer” generation is working, saving, and investing during the ’80-’90s bull market.
- 50’s: From 2000 to 2002, the “Dot.Com” crash cuts investments by 50%.
- 53-57: From 2003-2007, the market grows savings back to breakeven.
- 57-58: The 2008 “Financial Crisis” wipes out 100% of the gains of the previous bull market and resets savings values back to 1995 levels.
- 58-63: From 2009-2013, financial markets rose, growing savings back to the turn of the century.
- 63-71: In 2021, investors finally made some progress towards their retirement goals.
Today, for most individuals heading into retirement, the importance of “mean-reverting events” should not be dismissed.
A Simple Backtest
To successfully invest for the long-term requires the avoidance of the destruction caused by crashes. Such is where even the most basic forms of technical analysis can supplement a good portfolio allocation strategy.
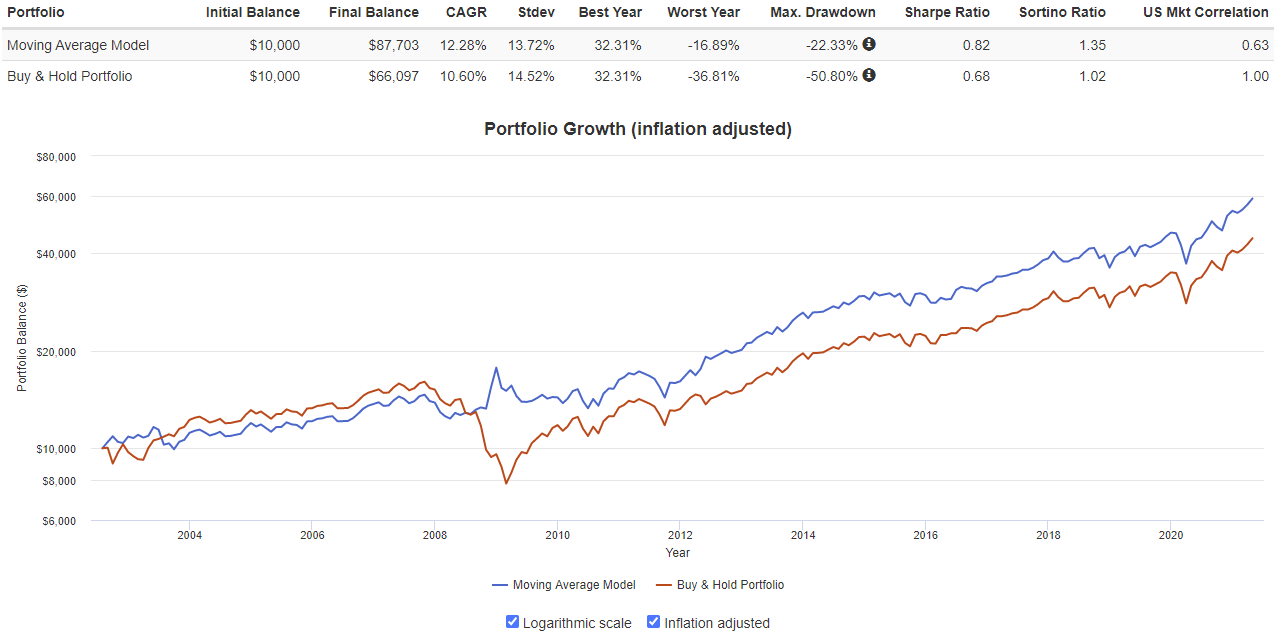
Using Portfolio Visualizer, I show a simplistic backtest of a switching model from stocks (SPY) to bonds (TLT.)
“Tactical asset allocation model results from Aug 2002 to Apr 2021 for SPDR S&P 500 ETF Trust (SPY) is a function of a 10 calendar month simple moving average and 15 calendar month simple moving average crossover. The tactical asset allocation model is invested in the S&P 500 index when the short moving average is greater than or equal to the long moving average. Otherwise, the portfolio is invested in iShares 20+ Year Treasury Bond ETF (NASDAQ:TLT).”
I used this time frame to capture:
- The post “Dot.com” crash bull market,
- The “Financial Crisis” bear market,
- And the 12-year Central Bank infused “one-way” bull market.
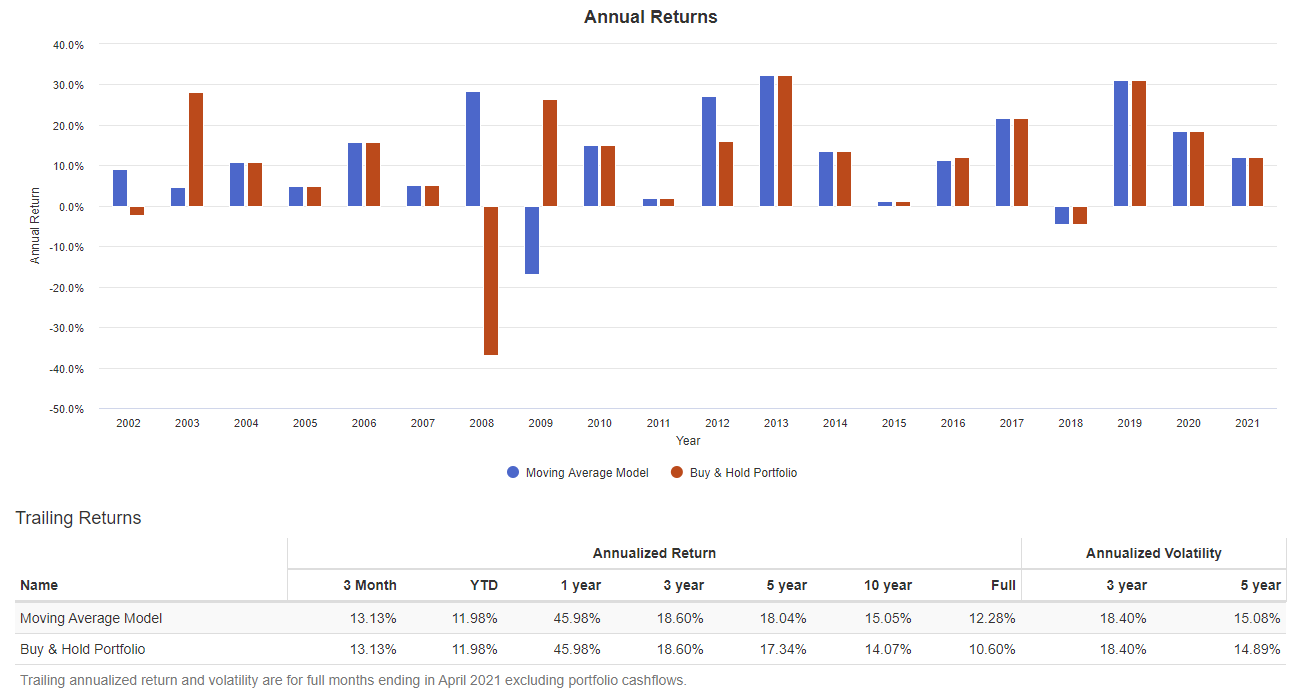
Portfolio Visualizer illustrates the annual returns and volatility:
Just An Example
Importantly, this is just an example of how technical analysis can improve returns over a “buy and hold” strategy during full-market cycles. During a bull cycle, “buy and hold” will outperform. However, as stated, you won’t know when that has changed until it is too late.
For example, an individual runs 100 stop signs without consequence and saves an hour driving to work. It is easy to assume that such activity is “risk-free” because no negative outcome has occurred. On the 101st event, the driver is hit and killed. Was applying the brakes and paying attention to the risk worth avoiding the eventual outcome?
The same applies to the markets. Just because there has been no consequence to investors taking on excess risk over the last 12-years doesn’t mean there won’t be.
Risks Are Mounting
“The temptation to book profits and bail is getting hard to resist after the S&P 500’s best 12-month rally since the 1930s. Increasing the anxiety are a mountain of charts signaling a market that’s stretched to its limits.”
Bloomberg is correct. Numerous measures are suggesting “risk” far outpaces “reward” currently. But technically, the market remains in a bullish trend for now. How do you navigate such a market safely?
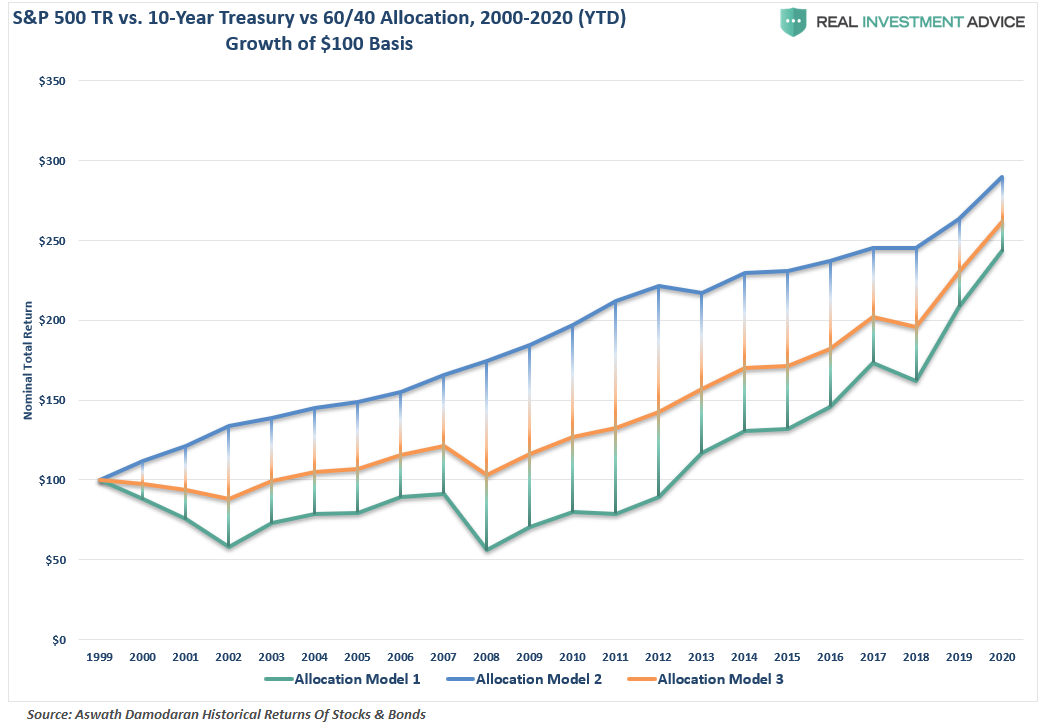
It is essential to understand that no one ever said you must be 100% allocated to equity risk at all times. The chart below shows three allocation models since 1999: 100% Stocks, 60% Stocks and 40% Bonds, and 100% Bonds.
Most would assume that the blue line is 100% stocks.
You would be wrong.
Since 1999, an all bond portfolio (blue line) and a 60/40 blended allocation (orange line) outperformed investors who were 100% long stocks. The reason is the reduction of capital destruction during mean-reverting events.
It is true that over the last 12 years, a 100% stock portfolio grossly outperformed other models. However, given the more extreme valuations, deviations, and speculative activity in the market today, it is unlikely the current streak will go uninterrupted into the future.
Investing Isn’t A Competition
The markets are indeed currently exceedingly exuberant on many fronts. With margin debt at records, stock prices near all-time highs, and “junk bond yields” near record lows, the bullish media continues to suggest there is no reason for concern.
Of course, such should not be a surprise. At market peaks “everyone’s in the pool.”
“The investor’s chief problem – and even his worst enemy – is likely to be himself.” Benjamin Graham
Such brings up some essential investment guidelines as we head into the last half of the year.
- Investing is not a competition. There are no prizes for winning but there are severe penalties for losing.
- Emotions have no place in investing. You are generally better off doing the opposite of what you “feel.”
- The ONLY investments that you can “buy and hold” are those that provide an income stream with a return of principal function.
- Market valuations (except at extremes) are very poor market timing devices.
- Fundamentals and Economics drive long-term investment decisions—“Greed and Fear” drive short-term trading.
- “Market timing” is impossible. Managing exposure to risk is both logical and possible.
- Investment is about discipline and patience. Lacking either one can be destructive to your investment goals.
- There is no value in daily media commentary. Turn off the television and save the mental capital.
- Investing is no different than gambling. Both are “guesses” about future outcomes based on probabilities.
- No investment strategy works all the time. The trick is knowing the difference between a bad investment strategy and one that is temporarily out of favor.
The one lesson you should have learned in 2020?
“The unexpected outcome occurs more often than you expect.”

