A couple of weeks ago, I discussed the coming “Pension Crisis.” The important point made was the unrealistic return assumptions used by pension managers in order to reduce the contribution (savings) requirement by their members.
“However, the reason assumptions remain high is simple. If these rates were lowered 1–2 percentage points, the required pension contributions from salaries, or via taxation, would increase dramatically. For each point reduction in the assumed rate of return would require roughly a 10% increase in contributions.
For example, if a pension program reduced its investment return rate assumption from 8% to 7%, a person contributing $100 per month to their pension would be required to contribute $110. Since, for many plan participants, particularly unionized workers, increases in contributions are a hard thing to obtain. Therefore, pension managers are pushed to sustain better-than-market return assumptions which requires them to take on more risk.
But therein lies the problem.
The chart below is the S&P 500 TOTAL return from 1995 to present. I have then projected for using variable rates of market returns with cycling bull and bear markets, out to 2060. I have then run projections of 8%, 7%, 6%, 5% and 4% average rates of return from 1995 out to 2060. (I have made some estimates for slightly lower forward returns due to demographic issues.)”
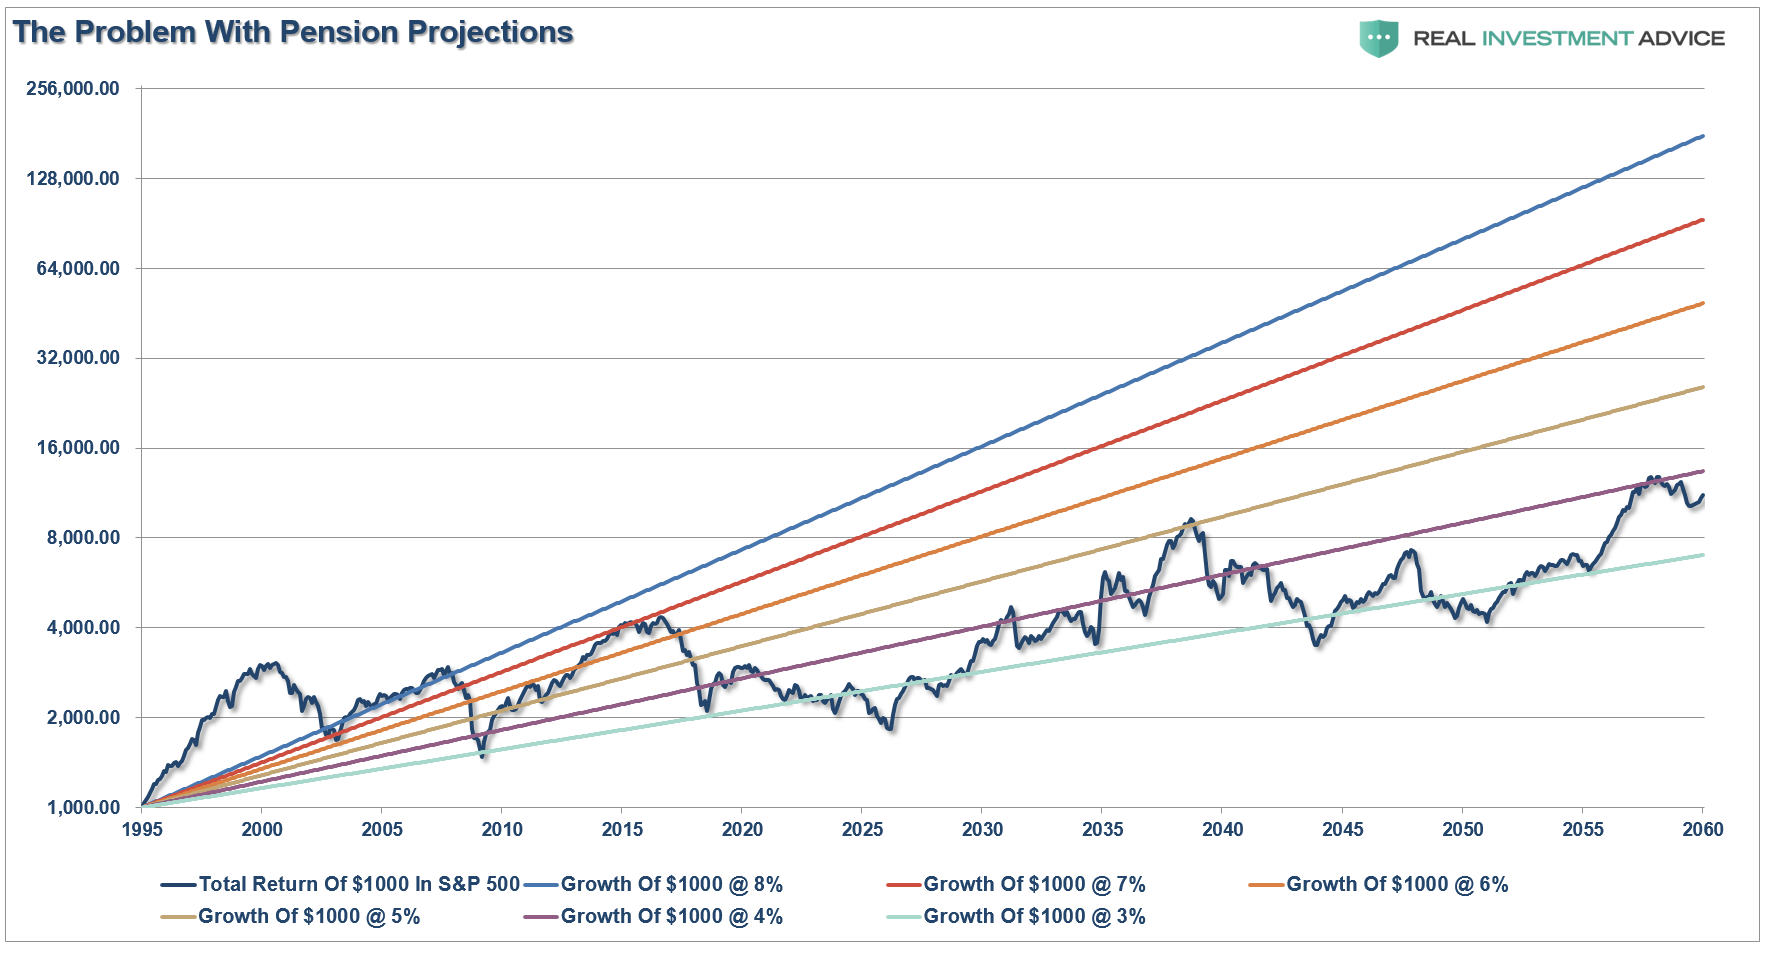
“Given real-world return assumptions, pension funds SHOULD lower their return estimates to roughly 3-4% in order to potentially meet future obligations and maintain some solvency.”
It is the same problem for the average American who plans on getting 6-8% return a year on their 401k plan, so why save money? Particularly when the mainstream media, and financial community, promote these flawed claims to begin with. To wit:
“Suze Orman explained that if a 25-year-old puts $100 into a Roth IRA each month, they could have $1 million by retirement.”
Ms. Orman’s statement is correct. It just requires the 25-year old to achieve an 11.25% annual rate of return (adjusting for inflation) every single year for the next 40-years. (That’s not very realistic)
Using faulty assumptions is the linchpin to the inability to meet future obligations. By over-estimating future returns, future retirement values are artificially inflated which reduces the required saving amounts need by individuals today. Such also explains why 8-out-of-10 American’s are woefully underfunded for retirement currently.
The Real Math
As shown in the long-term, total return, inflation-adjusted chart of the S&P 500 below, the difference between actual and compounded (7% average annual rate) returns are two very different things. The market does NOT return an AVERAGE rate each year, and one negative return year compounds the future shortfall.
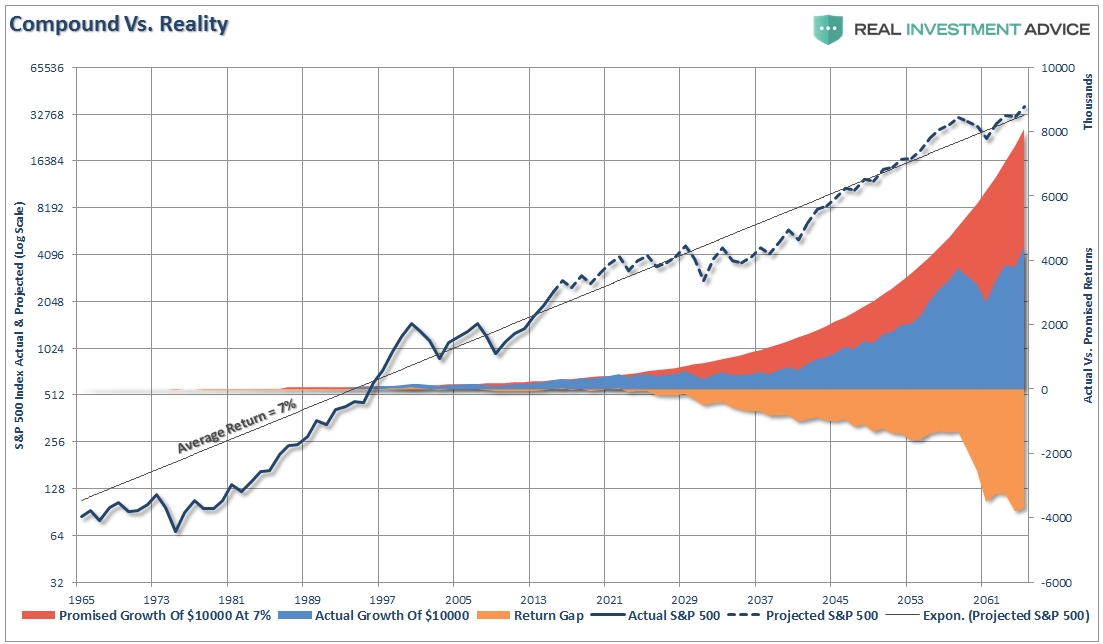
When imputing volatility into returns, the differential between what individuals are promised (and this is a huge flaw in financial planning) and what actually happens to their money is substantial over the accumulation phase of individuals. Furthermore, most of the average return calculations are based on more than 100-years of data. So, it is quite likely YOU DIED long before you realizing the long-term average rate of return.
Too Simple
I get it.
I am an average American too. I don’t want to be told what I can, and can not, spend or do today because I have a required savings goal to meet future needs. After all, that is YEARS into the future and I have plenty of time to get caught up. The words “budget” and “saving” might as well be lumped into the “4-letter word” category.
We all want a simple answer. If you do “X” then “Y” will be the outcome.
See, simple. It is why our world is being reduced to sound bytes and 140-character compositions. Financial, retirement and investment planning are no different. Just give me an “optimistic” answer.
For example, as shown in the chart below courtesy of Michael Kitces, the common assumptions made in retirement planning are simple. The chart assumes a retiree has a $1,000,000 balanced portfolio and is planning for a 30-year retirement. It assumes inflation averages 3% and the balanced portfolio averages 8% in the long run. To make the money last for the entire time horizon, the retiree would start out by spending $61,000 initially and then adjusts each subsequent year for inflation, spending down the retirement account balance by the end of the 30th year.
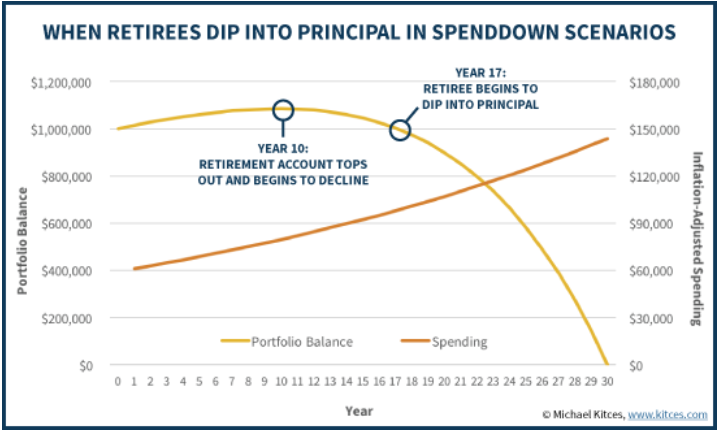
See, that’s pretty simple. You just start with $1 million and spend no more than $61,000 annually and get a return of 8% every single year until you die.
What could go wrong with that?
The chart below expands on Kitces’ chart above by adjusting the 8% return structure for inflation at 3% and also adjusting the withdrawal rate up for taxation at 25%.
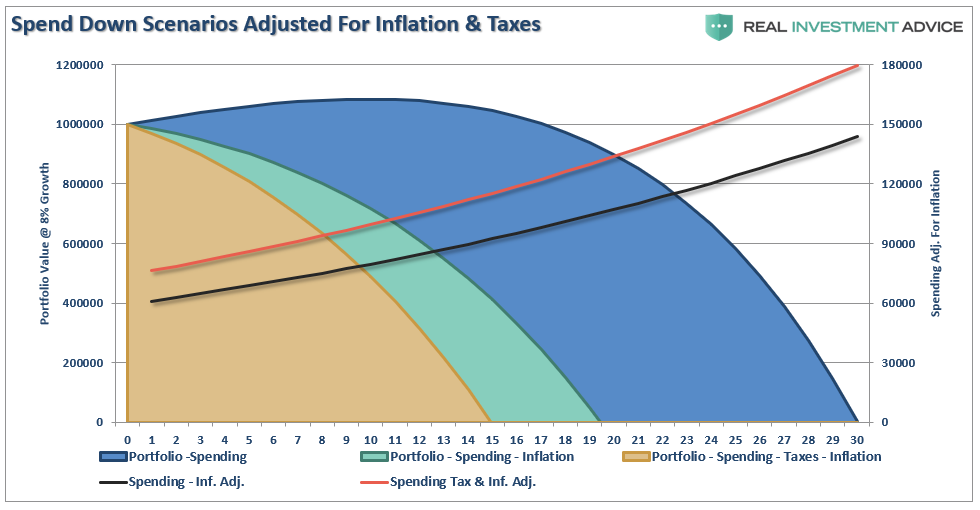
By adjusting the annualized rate of return for the impact of inflation and taxes the life expectancy of a portfolio grows considerably shorter. However, the other problem, as first stated above, is there is a significant difference between 8% annualized rates of return and 8% real returns.
The Impact Of Variability
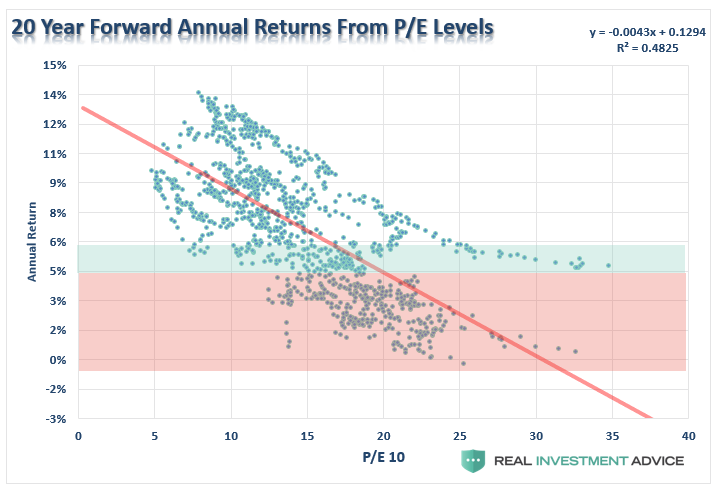
Currently, the S&P 500 (as of 5/8/2018) is trading at 2,727 with Q1 trailing reported earnings of $116.49. (S&P Data) This puts the current trailing P/E ratio of the S&P at a rather lofty 23.4x.
We also know that forward returns from varying valuation levels are significantly depend on when you start your investing. As shown in the chart below, from current valuation levels, forward returns from the market have been much closer to 2% rather than 8%.
This is better explained by showing the value of $1000 invested in the markets at both valuations BELOW 10x trailing earnings and ABOVE 20x.
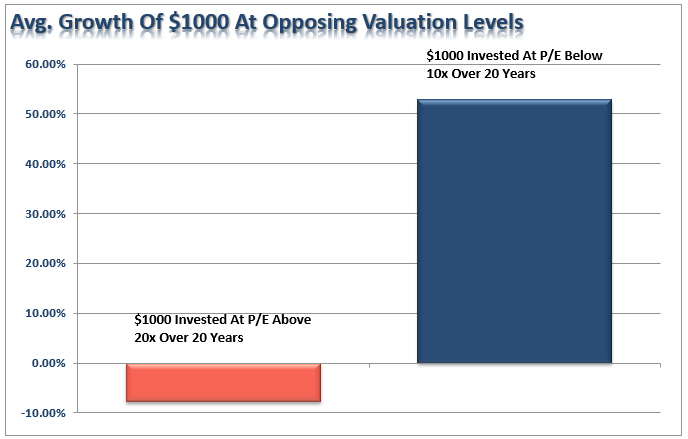
As you can see, WHEN you start your investing, or more importantly your withdrawals, has the greatest impact on your future results.
With this understanding let’s go back to Kitces’ assumptions and change the rate of return from 8%, annualized and compounded, to real market returns based upon current valuation levels. For this exercise, using Robert Shiller’s data, I went back and located points in history when valuations exceeded 20x earnings. I then calculated real forward total returns from those points as compared to an 8% compounded rate.
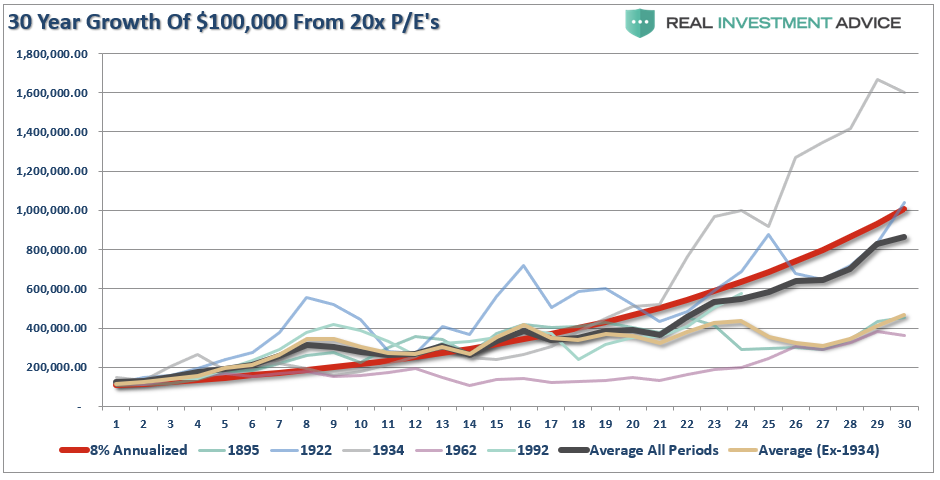
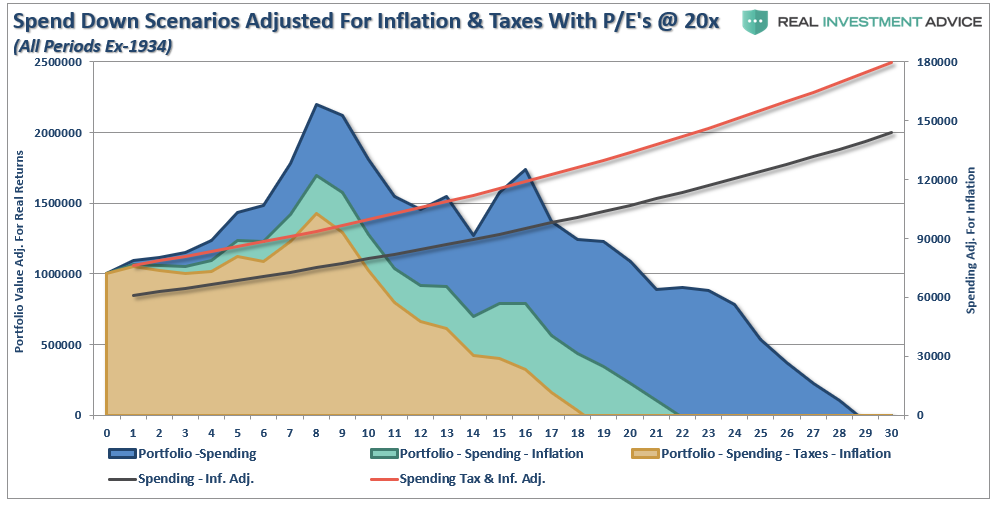
As you can see, with the exceptions of 1922 (front end loaded returns) and 1934 (as the markets left the Great Depression and entered into a post-WWII secular bull market), returns fared worse than the expected 8% rate. The next chart removes the 1934 period only for clarity purposes.
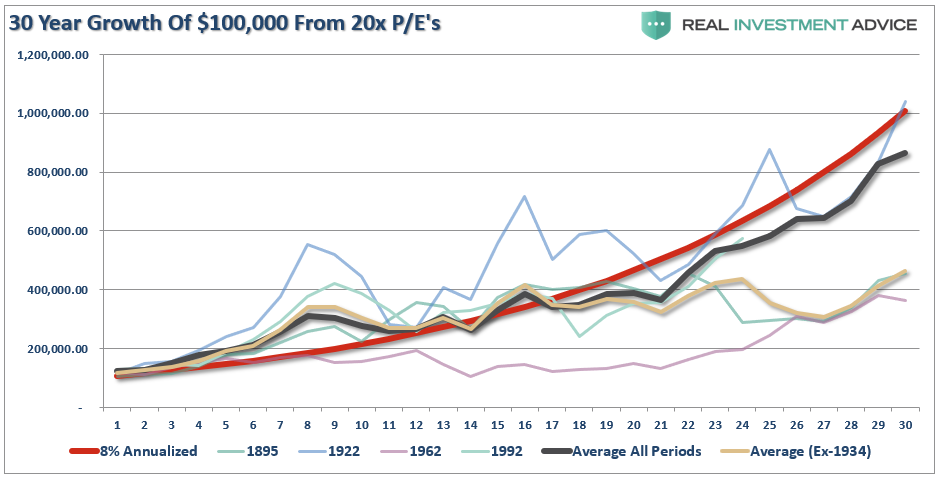
The next chart takes the average of all periods above (black line) and uses those returns to calculate the spend down rate in retirement assuming similar outcomes for the markets over the next 30-years. As above, I have calculated the spend down structure to include inflation and taxation on an initial $1 million portfolio.
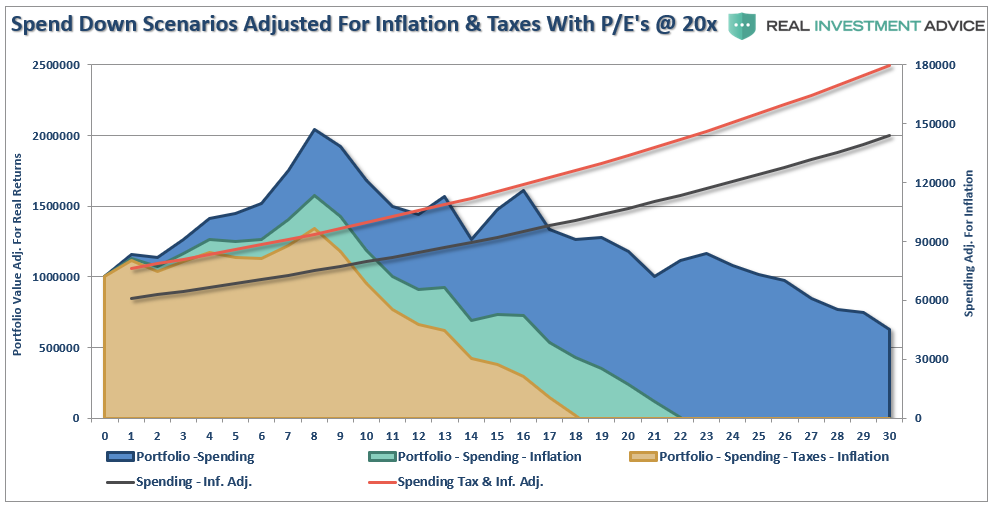
As you can see, under this scenario, due to the skew of 1934 and front-loaded returns, the retiree would not have run out of money over the subsequent 30-year period. However, once the impact of inflation and taxes are included, the outcome becomes substantially worse.
The chart below shows the same as above but with the 1934 period excluded. The outcome, not surprisingly, is not substantially different with the exception of the retiree running out of money one-year short of their goal rather than leaving an excess to heirs.
Important Considerations For Retiree Portfolios
Currently, 75.4 million Baby Boomers in America—about 26% of the U.S. population—have reached, or will reach, retirement age by 2030. Unfortunately, the majority of these individuals are woefully under saved for retirement and are “hoping” for compounded annual rates of return to bail them out.
It isn’t going to happen and the next “bear market” will wipe most of them out permanently.
The analysis above reveals the important points individuals should start giving serious consideration to:
- Lowering expectations for future returns and withdrawal rates.
- With the potential for front-loaded returns going forward unlikely, increase savings rates.
- The impact of taxation must be considered in the planned withdrawal rate.
- Future inflation expectations must be carefully considered, it’s better to overestimate.
- Drawdowns from portfolios during declining market environments accelerates the principal bleed. Plans should be made during up years to harbor capital for reduced portfolio withdrawals during adverse market conditions.
- Future income planning must be done carefully with default risk carefully considered.
- Most importantly, drop compounded annual rates of return for plans using variable rates of future returns.
In this Central Bank driven world, with debt levels rising globally, interest rates rising, economic growth weak with a potential for a recession, and valuations high, the uncertainty of a retirement future has risen markedly. This lends itself to the problem of individuals having to spend a bulk of their “retirement” continuing to work.
Of course, this could be why there are currently more individuals over the age of 65 still in the workforce than ever before in history.
Oh, and there also the tiny fact the majority of American’s don’t have $1 million saved for retirement. For most it is less than $250,000.
But that is an entirely different problem.
