This past weekend, I discussed the current extension of the market. To wit:
“In the short-term, the market trends are CLEARLY bullish, very overbought, but nonetheless bullish.”
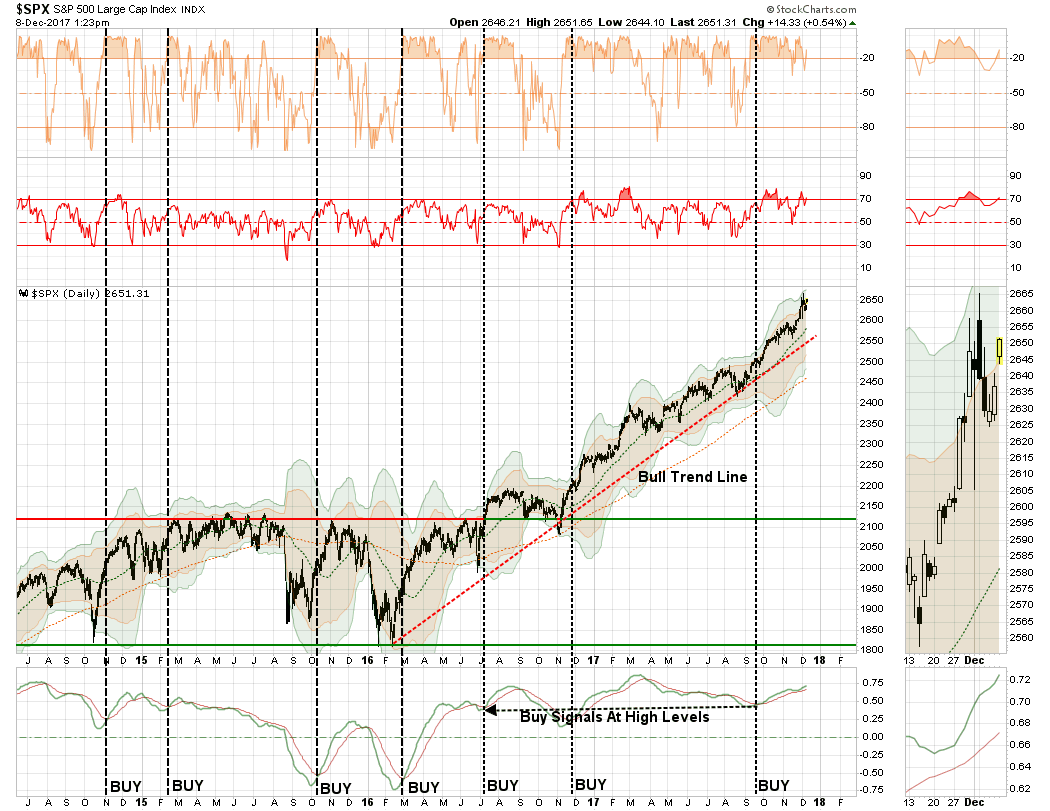
“As such, our portfolios remain ‘long’ on the equity side of the ledger…for now. “
The current momentum behind the market advance is clearly bullish, and with the “smell of tax reform” in the air, there is little to derail the bulls before year-end.
As I previously wrote, I am still somewhat suspicious of the markets going into 2018. As I laid out over the last couple of weeks, I believe the risk of “tax-related” selling is a strong possibility at the beginning of the year as portfolios lock in gains without having to pay taxes until 2019. While the risk to the overall market trend remains small, a correction of 3-5% is possible. I am still looking for the right “setup” by the end of the month to add a small “short S&P 500” position to portfolios and increase longer-duration bond exposure to hedge off some of the potential risks.
I will keep you apprised, of course.
However, in the meantime, there seems to be nothing stopping the market from going higher. As stated in the title, the current push higher puts 2700 in sight by the time Santa fills the “stockings hung by the chimney with care.”
As shown below, price momentum triggered a short-term “buy” signal following Thanksgiving, and after the brief “AMT Tax Debacle” in the Senate Tax Bill, momentum again has turned up as prices continue to press higher.
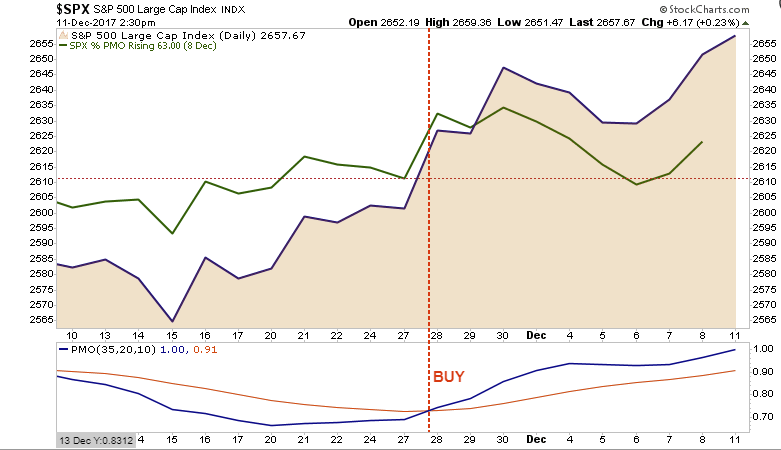
As noted above, this “momentum” keeps portfolios allocated towards equity risk, but we continue to be prudent about the risk we are taking and continue to hedge risk as necessary.
It’s All About Liquidity
As I have discussed previously, what fundamental strength there is in the market currently was long-ago priced in. The reality is this continues to be a liquidity driven market through Central Bank interventions. The correlation between the NYSE Advance/Decline line and the Japanese yen shows the “carry trade” that arises from these monetary interventions.
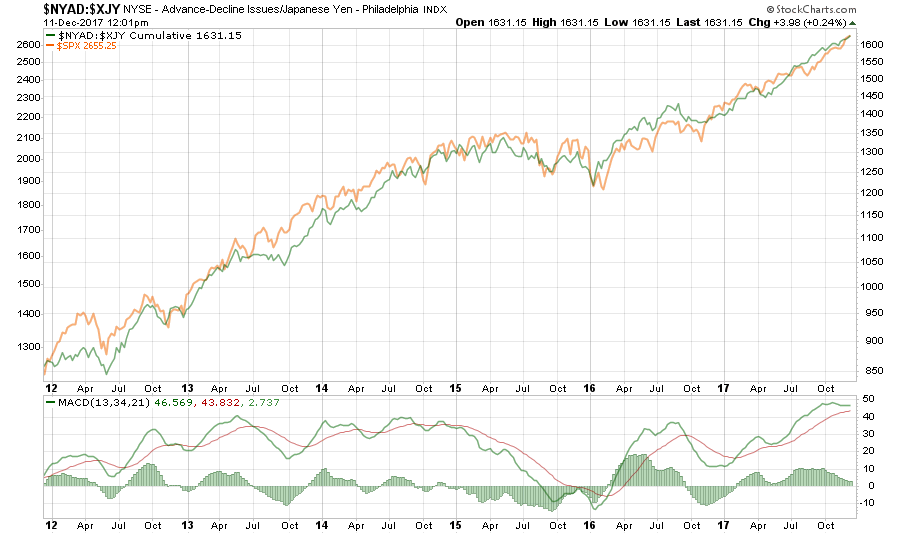
Following the early 2016 correction, the “carry trade” has picked up steam and has continued to force asset prices higher as liquidity seeks opportunity. With the “carry trade” now extremely extended currently, which is also highly leveraged, watch for a triggering of a “sell signal” as a sign to temporarily reduce equity-related risk.
But wait, the Fed is reducing their liquidity flows into the financial system, right?
Not so much.
As shown in the first chart below, the Fed’s balance sheet continues to remain stable even as asset prices surge.
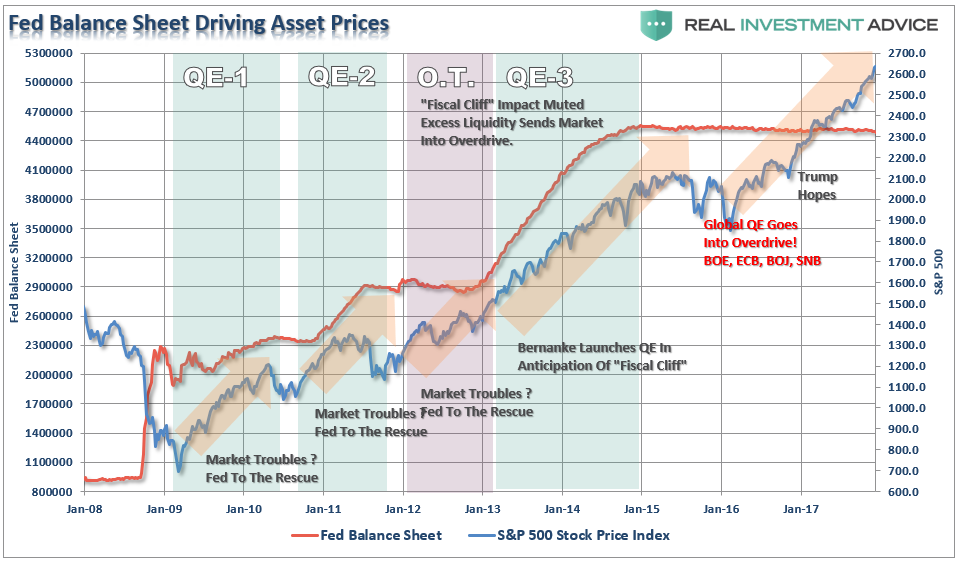
With global Central Banks still flooding the system with liquidity, the Fed has yet to begin rolling off their reinvestments as expected. In fact, the Fed made a timely reinvestment during the “Senate Tax Bill” debacle earlier this month.
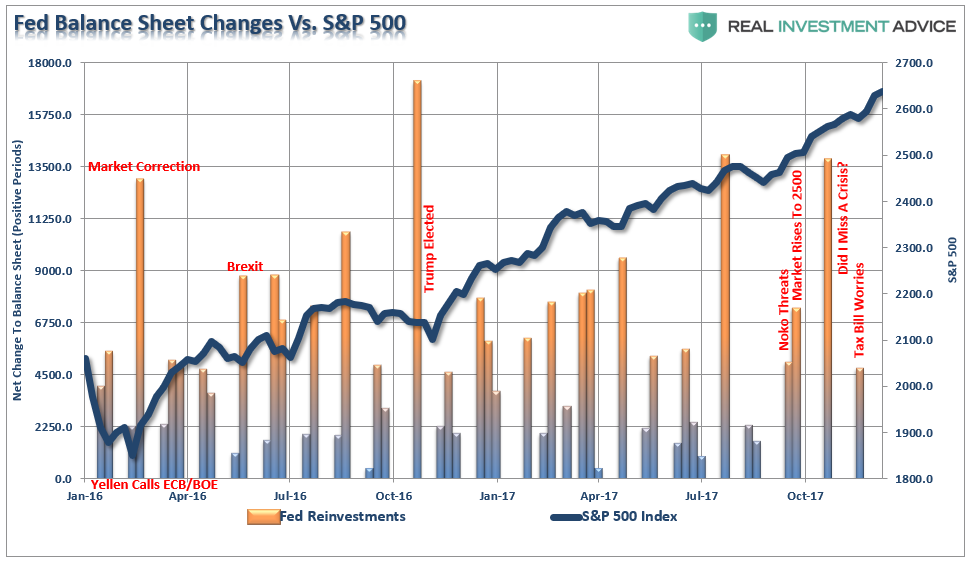
Of course, that bump of liquidity sent asset prices rocketing higher.
The question becomes just what will happen to the markets when the Fed actually does begin to aggressively decrease their “reinvestments” in the coming year. The projected decline in the balance sheet looks like the following:
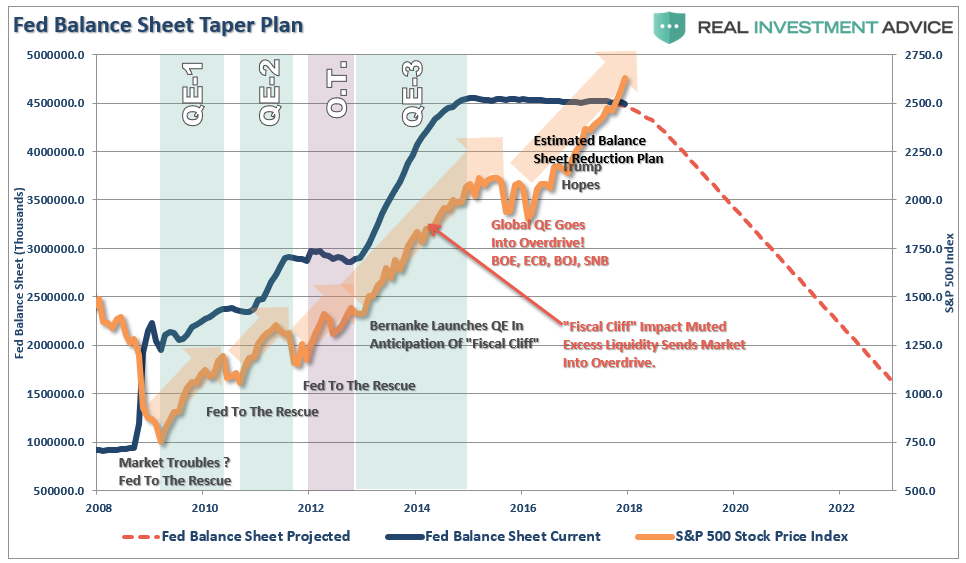
One can only imagine how a market which has been repeatedly driven higher on a “feast of liquidity,” either from the Fed or other Central Banks, will react to being put on a diet.
The consequences for investors is likely not optimal, particularly given, as discussed this past weekend, the degree of extensions in the market from both long and short-term moving averages. As shown, there are only a few occasions in history where the market has gotten extremely deviated from it 6-year moving average as it is now.
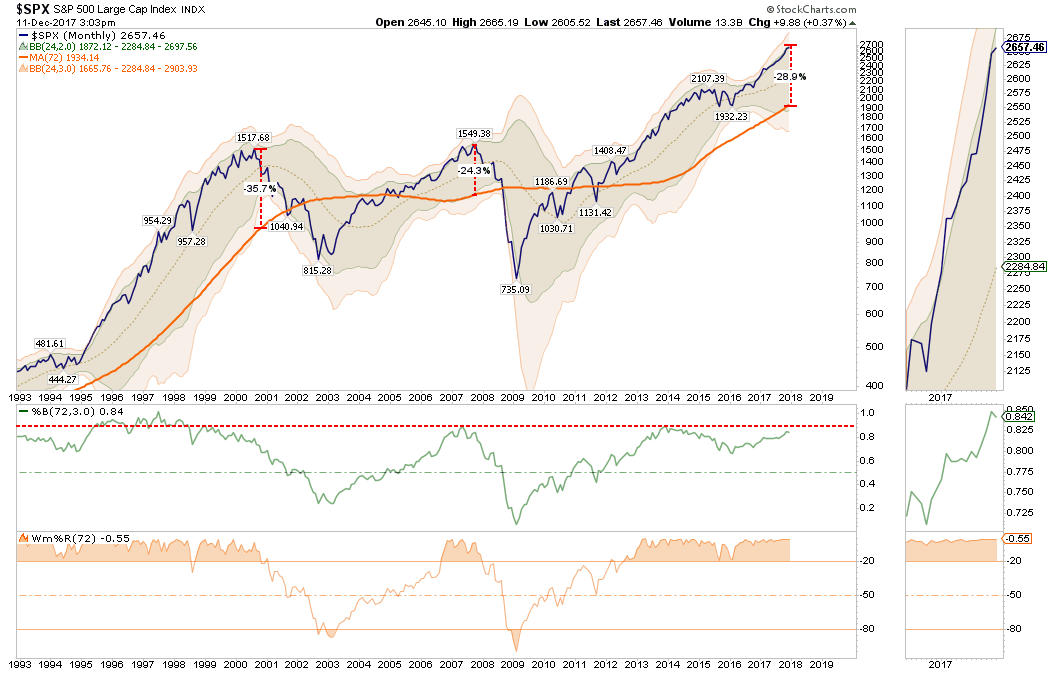
Such deviations do not necessarily mean a crash is coming tomorrow, as shown, irrational exuberance can last much longer than logic would otherwise dictate. However, with the economy running at substantially weaker levels of growth, the ability to leverage debt limited, and valuations already grossly extended, a repeat of the late-90’s is much less likely currently.
The current environment, while bullish, is much more fragile than what was witnessed at the end of the last century hence the need for ongoing “emergency measures” from global Central Banks. This is due to:
- Weakness in revenue and profit growth rates
- Stagnating economic data
- Deflationary pressures
- Excessive bullish sentiment
- Rising levels of margin debt
- Expansion of P/E’s (5-year CAPE)
(For visual aids on these points read: 4 Warnings For The Bull Market)
But, for now, the bull charges on.
2700 by Christmas? It’s likely as asset managers try to make up ground, performance wise, before year-end reporting.
How To Play It
With the markets currently in extreme intermediate-term overbought territory, it is likely that the current “hope driven” rally is likely near a short-term top.
For individuals with a short-term investment focus, pullbacks in the market can be used to selectively add exposure for trading opportunities. However, such opportunities should be done with a very strict buy/sell discipline just in case things go wrong. (See last week’s post for guidelines)
However, for longer-term investors, and particularly those with a relatively short window to retirement, the downside risk far outweighs the potential upside in the market currently. Therefore, using the seasonally strong period to reduce portfolio risk and adjust underlying allocations makes more sense currently. When a more constructive backdrop emerges, portfolio risk can be increased to garner actual returns rather than using the ensuing rally to make up previous losses.
For More Read: “You Can’t Time The Market?”
With our portfolios invested at the current time, it makes little sense to focus on what could go “right.” You can readily find that case in the mainstream media which is biased by its needs for advertisers and ratings. However, by understanding the impact to portfolios when something goes “wrong” is inherently more important. If the market rises, terrific. It is when markets decline that we truly understand the “risk” that we take. A missed opportunity is easily replaced. However, a willful disregard of “risk” will inherently lead to the destruction of the two most precious and finite assets that all investors possess – capital and time.
Just something to consider when the media tells you to ignore history and suggests “this time may be different.”
That is usually just about the time when it isn’t.
