After stumbling in May, technology stocks have rebounded sharply in June, regaining this year’s crown for top-performing U.S. equity sector, based on a set of exchange traded funds.
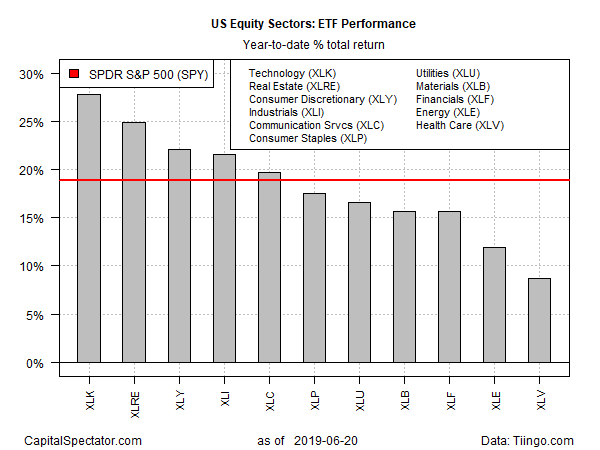
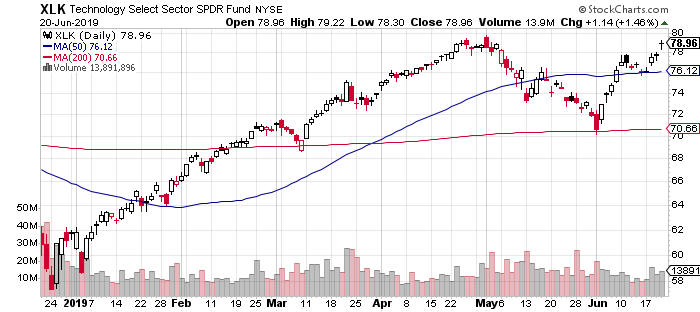
Technology Select Sector SPDR (NYSE:XLK) is up a sizzling 27.8% so far in 2019 through June 20 – sharply ahead of the broad stock market’s 18.9% return this year via SPDR S&P 500 (NYSE:SPY). Roughly half of tech’s year-to-date surge is due to this month’s rally. After slumping through most of May, XLK has mounted a dramatic revival.
Real estate, the second-strongest year-to-date sector performer (briefly in the lead last month), has fallen behind tech in the 2019 horse race, albeit marginally and largely because of tech’s strength. Real estate shares have risen consistently in recent weeks, although keeping up with tech has been tough this month. Real Estate Select Sector SPDR (NYSE:XLRE) is ahead by a strong 24.9% so far this year.
Notably, all the major equity sectors continue to post gains for 2019. Even the weakest performer has delivered a respectable run. Health Care Select Sector SPDR (NYSE:XLV) is firmly in positive terrain, although the ETF’s 8.7% year-to-date increase pales next to the leading sector performances.

Tech is on top, but some analysts have recently been warning that the sector’s overvalued and the threat of increased regulation may be lurking. “Rising market concentration and the political landscape suggest that regulatory risk will persist and could eventually weigh on company fundamentals,” Goldman Sach’s chief U.S. equity strategist warned last week. “The valuation premium for growth is elevated today relative to history; software in particular now carries the highest multiples since the tech bubble.”
Meanwhile, tighter regulation may be looming for the tech sector. The Justice Department is reportedly considering an anti-trust probe of Google (NASDAQ:GOOGL) and is looking into a possible investigation of Apple (NASDAQ:AAPL).
Based on the rear-view mirror, however, tech remains resilient. At the end of yesterday’s trading, XLK closed at a record high.

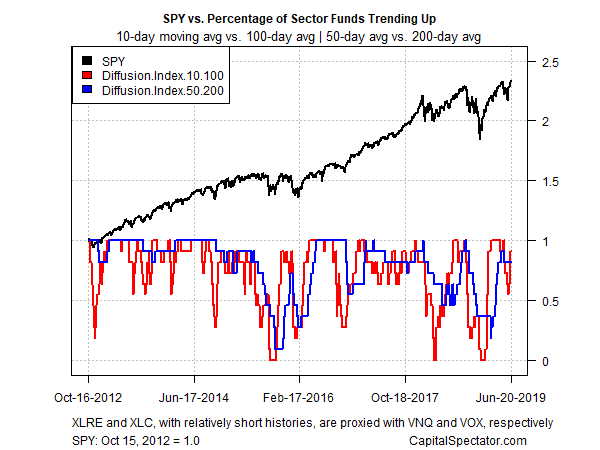
The June rally has, in fact, lifted all sector boats. In turn, the revival of animal spirits has put a new spring in the step of our momentum profile of sector ETFs. After stumbling in May, two measures of price trend have firmed up lately. The first of the pair compares the 10-day moving with the 100-day average, a measure of short-term trending behavior (red line in chart below). A second set of moving averages (50 and 200 days) offers an intermediate measure of the trend (blue line). The indexes range from 0 (all funds trending down) to 1.0 (all funds trending up).

Using prices through yesterday shows that most sector ETFs continue to post bullish momentum. Indeed, the market overall (based on the S&P 500 Index) is at a record high as of yesterday’s close.
U.S. stocks, in short, are priced for perfection. Cue the contrarians, including one perennially skeptical analyst who insists that “stocks are now offering the best selling opportunity in 10 years.”
