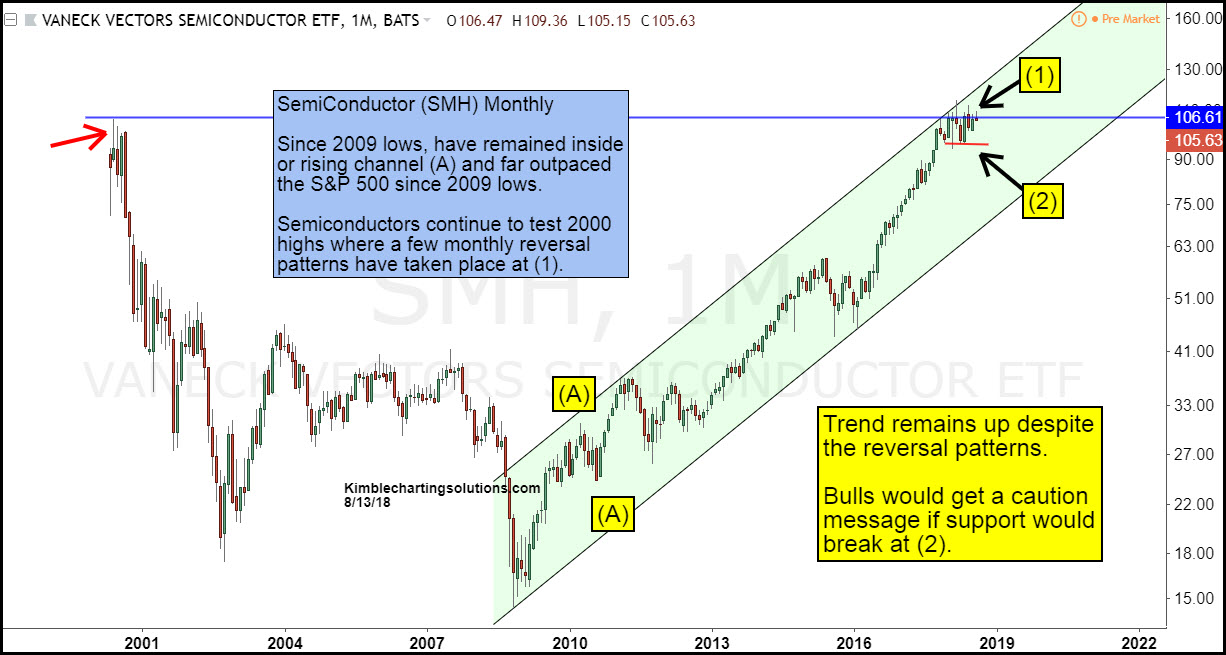
Semiconductors (NYSE:SMH) have been bullish leaders for the broad market since the lows in 2009. Over the past 9 years, SMH has nearly doubled the upside gains of the S&P 500 and has been stronger than the NDX 100 as well.
The 500%+ gains since the 2009 lows have SMH testing the highs of 2000 at (1). While testing those highs this year, SMH created a few monthly reversal patterns. Even though these reversal patterns have taken place, sellers have not been able to gain the upper hand.
The bullish trend for SMH remains intact. It would take a break of support at (2) for this leading tech ETF to send a bearish message to the broad market.
