US equities ended broadly higher overnight as boosted by tax cuts optimism. DOW gained 0.40% to 24922.68 and 25000 handle is within reach. S&P 500 closed solidly above 2700 handle at 2713.06, up 0.64%. NASDAQ also rose 0.84% to 7065.53. All three indices were at records. Nikkei follows today and surges close to over 2.6% through 23300. Dollar was also lifted by Fed officials's discussion that tax cuts could prompt faster rate hike. But for the moment, the greenback is still traded in red against all but Swiss Franc for the week. More support is needed from economic data, possibly non-farm payroll and wage growth, to give the greenback a turnaround.
FOMC minutes showed optimistic economic outlook
The FOMC minutes for the December meeting revealed that policymakers were optimistic about the path of economic expansion. The December rate hike of +25 bps was data-dependent but a key factor was the strong employment market. An important part of the optimism over the economic outlook was driven by the tax reform plan. "Many participants" expected the personal tax cut would "provide some boost to consumer spending" while "a few participants" noted that expectations of tax reform may have already raised consumer spending somewhat. More in Strong Job Market Lifted FOMC's Optimism, Views on Inflating Outlook Remained Divided.
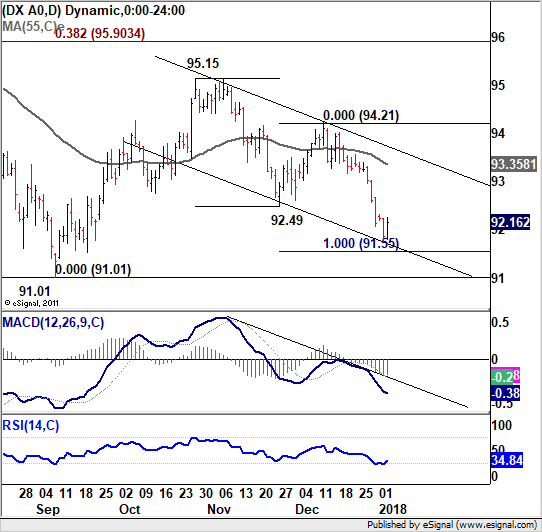
Dollar index back above 92
The dollar index reached as low as 91.75 earlier this week but is back above 92 handle. 91 is still seen as the key long term support level but it's looking vulnerable. And, if the fall from 95.15 is a corrective move, it should be above to end soon. The index is close to 100% projection of 95.15 to 92.49 from 94.21 at 91.55, the three wave correction target level. But break of 92.49 support turned resistance is the first hurdle to overcome. The second will be 55 days EMA (now at 93.35). Or, further downside acceleration will push the index through this 91 cluster support level to resume the down trend from 103.82. In that case, the index could target next cluster level at around 84.5/85 before bottoming.

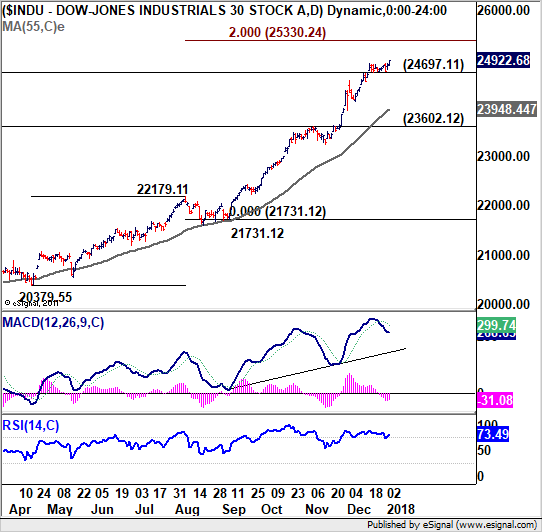
DOW on course for 25330.25
DOW's record fund continued as the new year starts. Long term up trend is still in progress for 200% projection of 20379.55 to 22179.11 from 21731.12 at 25330.25. Momentum is diminishing as seen with daily MACD turned below signal line in late December. But for the moment, near term outlook will remain bullish as long as 24697.11 support holds. Nonetheless, we'd pay attention to further loss of momentum as it approaches 25330.25.

On the data front
Japan PMI manufacturing was revised down to 54 in December. China Caixin PMI services rose to 53.9 in December, up from 51.9, above expectation of 51.8. PMI data will remain a focus in European session. UK will release PMI services, M4 and mortgage approvals. Eurozone will release PMI services final.
Later in the data, US job data will take center stage with ADP employment, jobless claims and Challenger job cuts featured. Canada will release IPPI and RMPI.
