The market has gone catatonic. Volume is anemic. The put/call ratio is the lowest it has been in twenty years. Daily ranges are as big as Hervé Villechaize. In spite of all that, let’s take a look and some updated index charts.
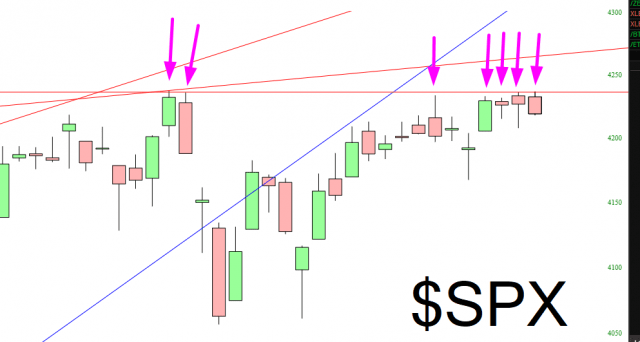
Starting off with the S&P 500, you can see that it has tried, and failed, on seven different occasions to push past the horizontal line. It’s getting kind of ridiculous at this point. Indeed, four days in a row just recently. I can’t remember ever seeing anything like this in my life. (Of course, in this totally fake market, nothing surprises me anymore).
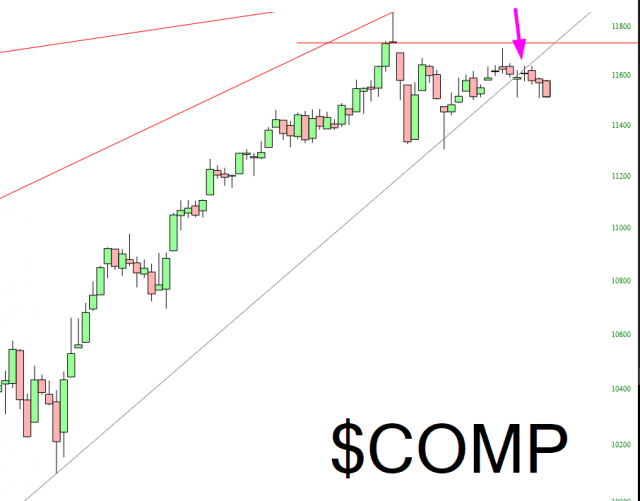
The Dow Composite broke its uptrend last week, and we’re making very slow but steady progress downward.
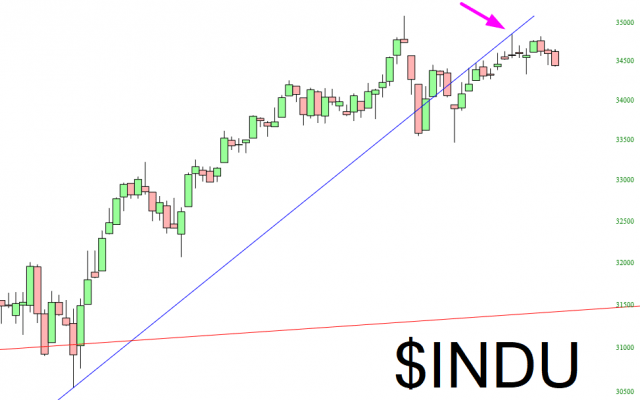
The best known subset of this index, the Dow 30 Industrials, broke its own uptrend much earlier, and the beautiful shooting star pattern I’ve pointed out below shows how there’s no doubt the trendline is being respected as resistance.
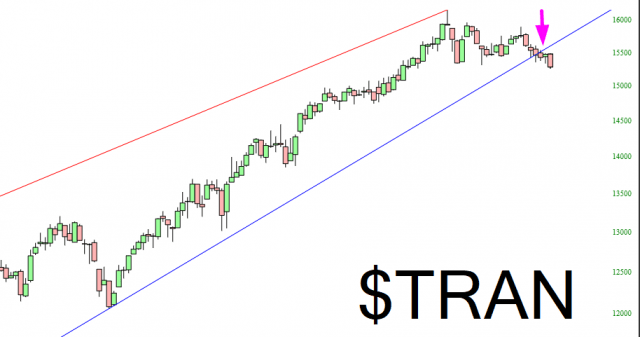
Importantly, its compadre the Dow 20 Transports just recently broke its own major uptrend. So the pieces are falling into place. I can just about taste it.
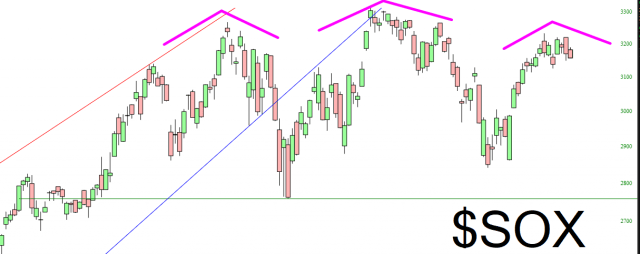
I’d also like to point out what might—and I emphasize might—be a jaw-dropping head and shoulders pattern on the semiconductors index. I mean, I’m just about to tear up by looking at this thing. As that son of a bitch traitorous bastard Powell has repeatedly demonstrated, patterns can be wrecked (as was done with the Russell 2000), but this is well worth monitoring.
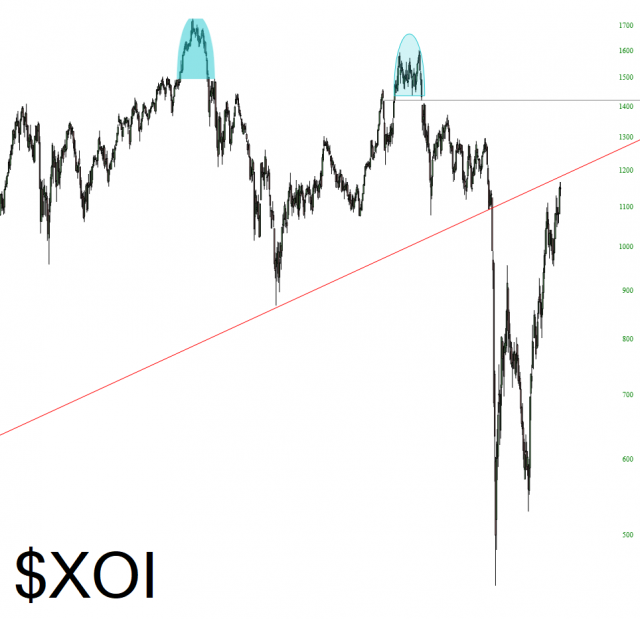
And I must state what again was a luscious setup the oil index is. Just beautiful.
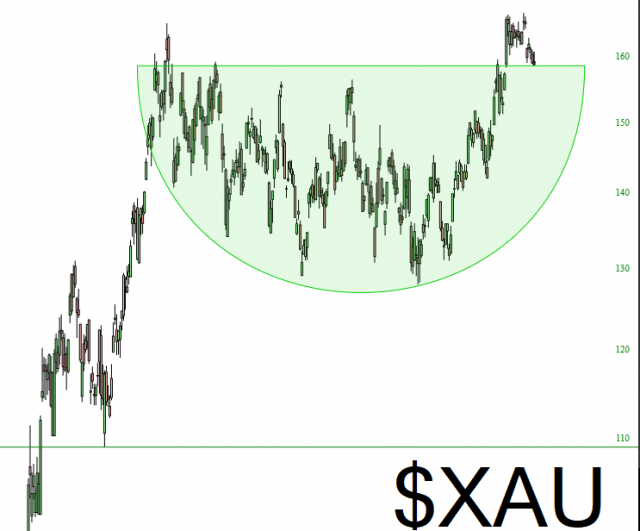
With all this blood-from-my-fangs bearishness, let me offer up one bullish setup, which actually lines up very nicely with the world-is-going-to-end narrative, and that is the gold bugs index. I like what I see!
