Over the past week the non-confirmation in Dow Theory between the (Industrials) and the (Transportation) widened. Both indexes have been painting a line for over two months. Now both indexes have broken out of their lines. The problem is DJIA broke upward and DJTA broke down. This creates a non-confirmation that warns of a possible long term trend change in the near future (next several months…remember Dow Theory is about the very long term trend). Until this non-confirmation clears with the transports moving to new highs (and of course the industrials too) investors should be cautious about adding new long positions.
On the other hand, if DJIA breaks the lower boundary of its range along with the transports then it will add a larger warning that the long term trend might be changing. Any low created after a break lower from the range in both indexes will create a new secondary low that will be the trigger point of a change from a bullish trend to a bearish one.
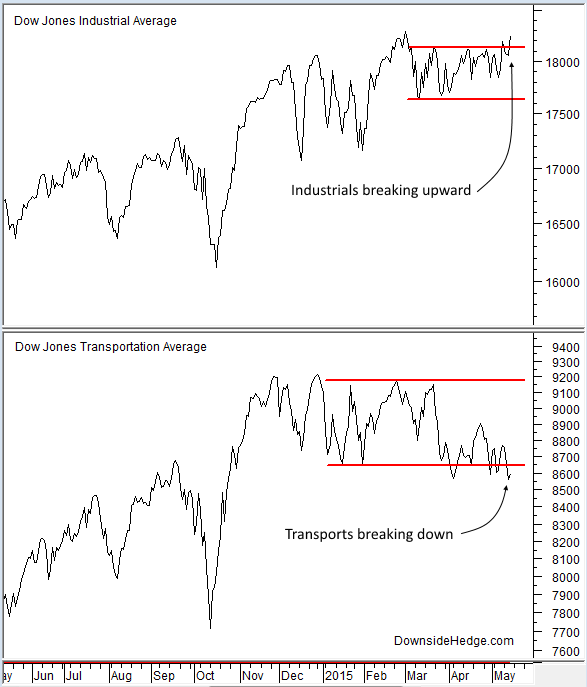
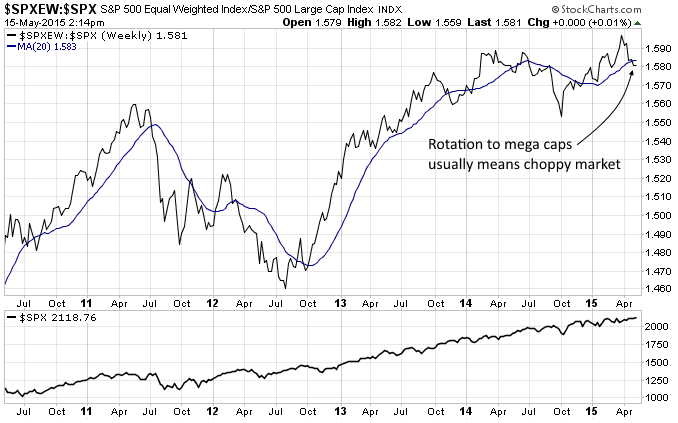
One caveat that adds some uncertainty is that some of the recent strength in the industrials comes from short term weakness in the US dollar. Money is flowing back to multinationals and mega cap stocks due to currency prices which muddies the picture. I’d rather feel confident that money is moving to DJIA due to strength in the economy or even a flight to safety to make a clear call. You can see more evidence of relative strength from mega caps with the ratio between the (S&P 500 Equal Weighted) and the S&P 500 Index (SPX). It is currently falling which indicates the largest of the large are being bought more aggressively that large caps.
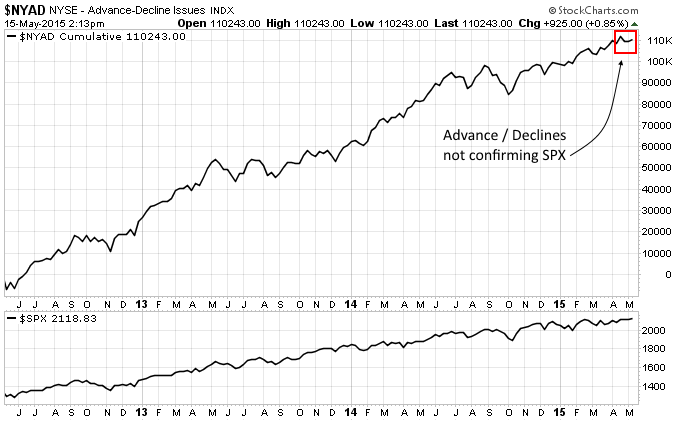
A couple more things to watch that put the push higher in the indexes in doubt comes from a few measures of breadth. First is the NYSE cumulative Advance / Decline line (NYAD). In healthy markets NYAD generally leads the market higher. Recently it has been leading the market lower and is currently lagging as SPX rises.
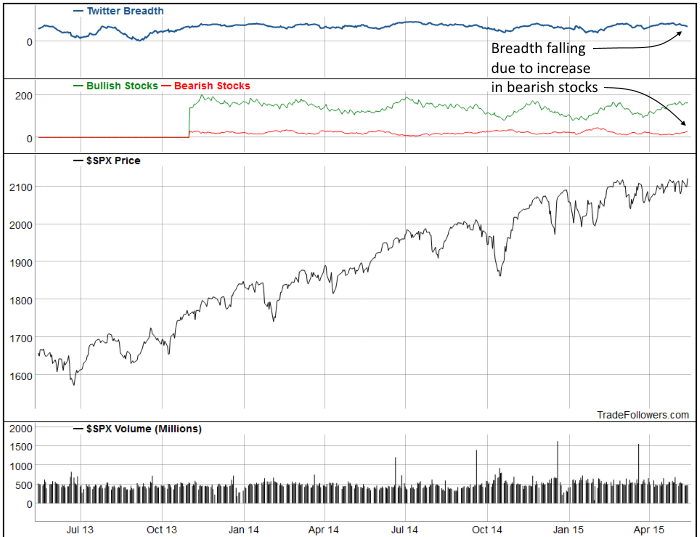
Another measure of breadth that is lagging the market comes from Trade Followers. It compares the number of bullish stocks on Twitter (NYSE:TWTR) to the bearish stocks. Recently the number of bearish stocks has been rising which isn’t a normal occurrence near all time highs. You can see an interactive chart of Twitter breadth here.
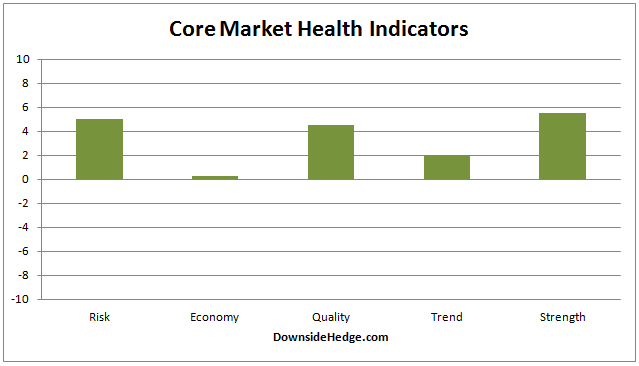
Our market health indicators mostly fell this week as SPX moved higher. Just another thing that puts this rally in doubt. However, none of them fell enough to change our current allocations from 100% long.
Conclusion
Unfortunately, I’m seeing signs that the current rally and attempt at new all time highs is not being supported by a firm foundation. The Dow Theory non-confirmation, a move to mega caps, and breadth failing to confirm the current rally suggest it’s time to watch the market carefully.