We have heard or read about it already. There is a Death Cross in the Dow Jones Industrials Average. Sounds scary right? But for the past 15 years haven’t we not been told that the Dow was dead as an index and every manager looked to the S&P 500? So why the change of heart? Seems the Dow only comes up when there is a Death Cross or a Dow Theory signal taking into account that other old time index that is not followed by anyone anymore, the Dow Transports. If I did not know any better I would think that who ever talks about the Dow only does it to try to scare investors. But maybe I am a cynic.
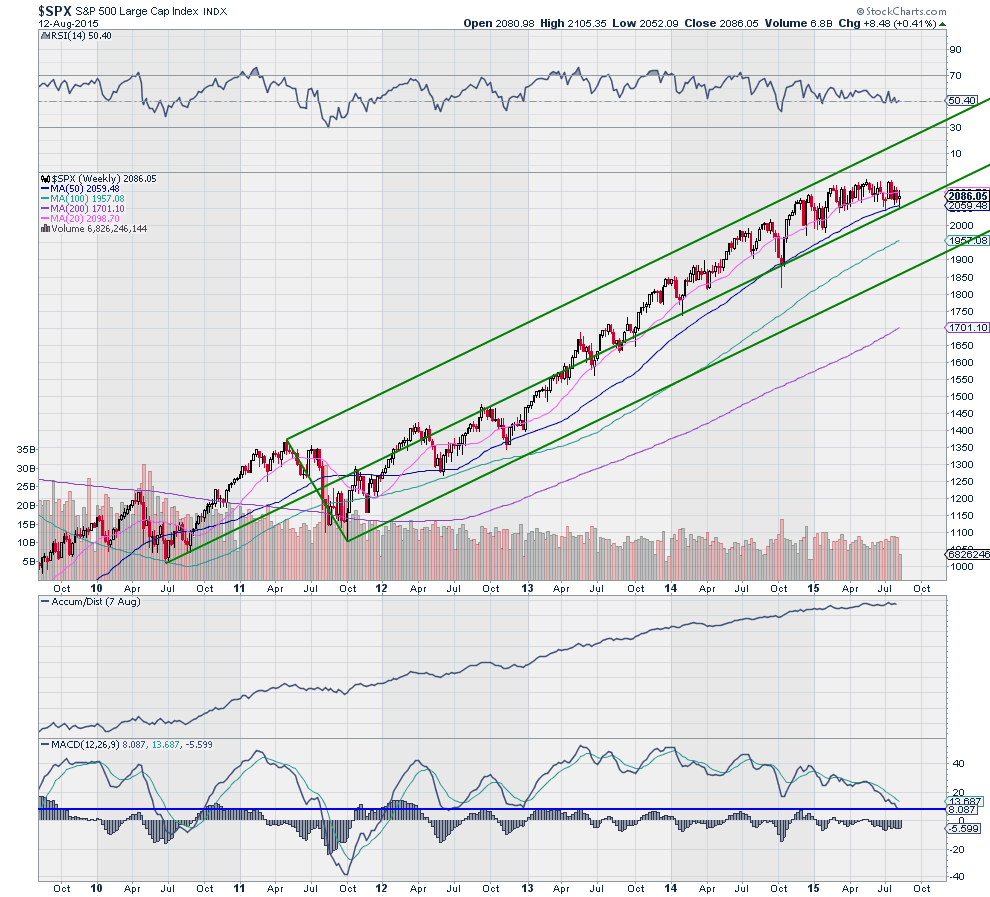
So while the Dow is is scaremongering trying to get attention, what is going on with the S&P 500? Well actually it looks quite healthy from the price action. The chart below shows the S&P 500 on a weekly basis over the last 6 years. It has one additional indicator turned on, the Andrews Pitchfork. This is not a predictive indicator showing a price target, but rather a simple representation to show the trend.

That pitchfork says a lot about the health of the S&P 500. Since crossing the Median Line for good in late 2013 it has pulled back to touch it twice. The first was in February 2014 and the second October 2014. This week will be the 3rd touch. That is all that has happened. In fact it has been a move sideways since February that has it back in touch with the Median Line.
What would it take for the uptrend shown in this chart to change? First, a break of the Median Line followed by a break of the Lower Median Line. If it were to drop straight down that would be at about 1860. That would be about a 13% drop from the high. But there are a lot of things working against even that scenario happening. First, all of the SMA’s except the 20 week SMA are rising. This has been a strong trend.
The RSI also remains bullish and well above the 40 level that has reversed the prior pullbacks. The accumulation/distribution statistic is rising. Only the MACD is running lower, but that is just getting to the level where the index reversed the last 3 times it reached the 100 week SMA. It will take a lot more than a 6 month sideways correction through time to end this trend.
The information in this blog post represents my own opinions and does not contain a recommendation for any particular security or investment. I or my affiliates may hold positions or other interests in securities mentioned in the Blog, please see my Disclaimer page for my full disclaimer.
