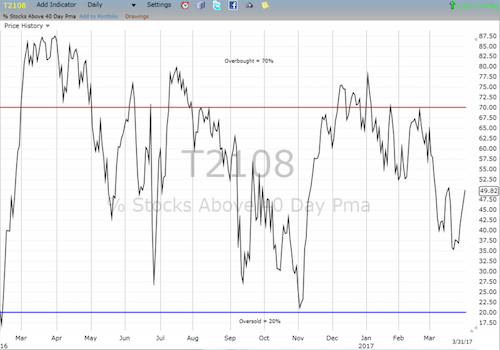
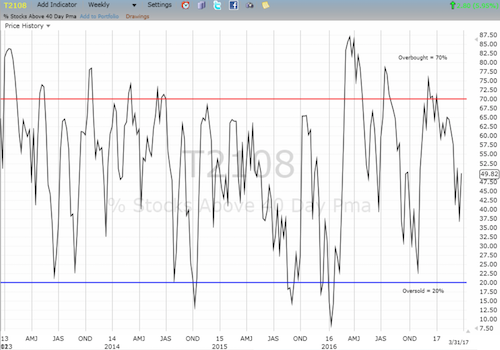
AT40 = 49.8% of stocks are trading above their respective 40-day moving averages (DMAs)
AT200 = 63.3% of stocks are trading above their respective 200DMAs
VIX = 12.4 (volatility index)
Short-term Trading Call: cautiously bullish (see caveats below)
Commentary
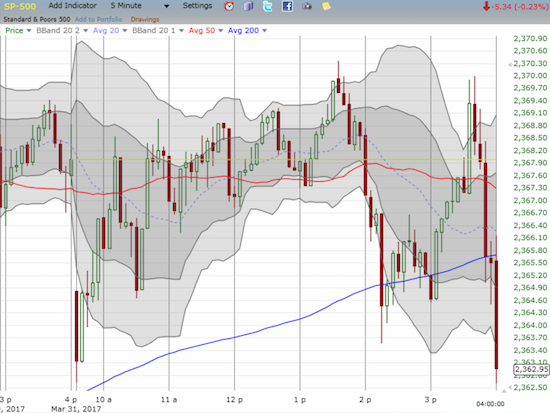
On Thursday, March 30 (2017), the S&P 500 (SPDR S&P 500 (NYSE:SPY)) closed above its downtrending 20-day moving average (DMA) and finally tipped my short-term trading call back into the camp of the bulls (per the rule I laid out in the my previous “Above the 40“). However, this change is VERY marginal because the index closed the week by gapping down at the open below its 20DMA, rallying to a marginal intraday gain, and then sharply selling off into the close. It was quite a lukewarm way to end a celebratory week.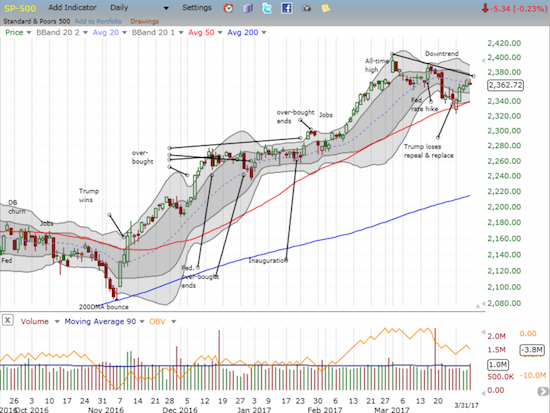
The S&P 500 (SPY) started the week with a strong bounce off uptrending 50DMA support, but the index stopped short of a challenge of the short-term downtrend from the all-time high that began the month of March.
This 5-minute chart shows how easily traders swung intraday between buying and selling. The close was particularly notable with a rapid bout of selling in the last 25 minutes.
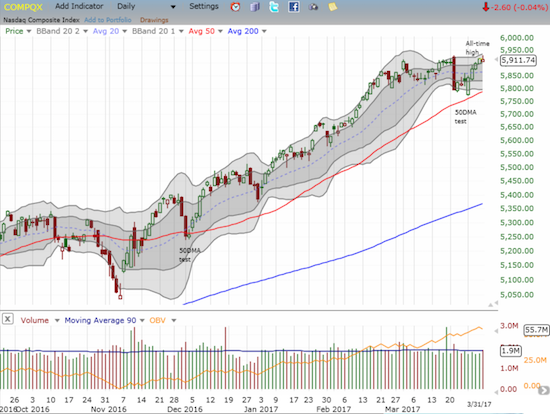
The NASDAQ (NASDAQ:QQQ) has significantly diverged from the S&P 500 as it managed to set a new (marginal) all-time closing high the previous day.
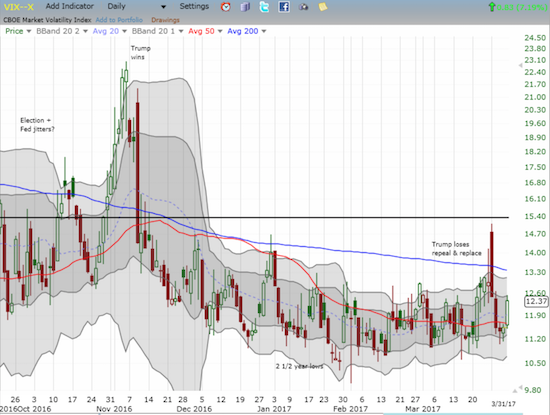
The selling into the close was swift enough to push the volatility index, the VIX, to a 7.2% gain. The VIX still ended the week with a loss, but suddenly traders are back to worrying about what Monday will bring.
The volatility index, the VIX, perked back up and highlighted the pivot role of its 50DMA.
AT40 (T2108), the percentage of stocks trading above their respective 40DMAs, ended the week on a strong note. While it faded a bit from its intraday high at 52.6%, it still closed with an additional 3 percentage point gain, a 2-week high, and 4 straight days of gains. AT200 (T2107), the percentage of stocks trading above their respective 200DMAs, performed similarly.
The S&P 500 failed to confirm my switch to bullishness. Stopping short of the short-term downtrend is particularly disappointing. So, my short-term trading call sits at a lukewarm “cautiously bullish.” However, I am encouraged by the strength of the tech-laden NASDAQ (although it failed to produce a major confirmation of its new all-time high) and even more encouraged to see the bullish divergence of AT40 from the S&P 500. I am inclined to expect a strong open to April as the S&P 500 recomposes itself. I used the morning’s gap down to load up on ProShares Ultra S&P500 (NYSE:SSO) shares. The fast selling into the close got me a fill on a low-ball offer for call options on SSO.
With AT40 still under 50%, I am fully committed to a bullish bias from here UNTIL AT40 gets to overbought status. I will re-evaluate at that time. A sell-off from here, even one that breaks this week’s intraday low on the S&P 500, will just prepare me for positioning for an oversold play. Granted, in the background, I fully recognize that the clock is still ticking away on this period of extremely low volatility. My historical analysis of these periods suggested that the first notable correction (at least 5%) will come sometime in May.
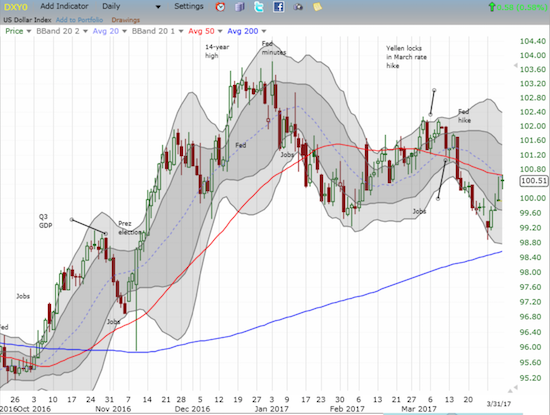
The U.S. dollar index also stopped short of an important juncture. A week ago, I noted the breakout of EUR/USD over 200DMA resistance. Given speculators were retreating on their net short positions, I suggested it might be time to buy the dips on the euro (Guggenheim CurrencyShares Euro (NYSE:FXE)). Before I could even do a rethink, the euro delivered on a big dip. The euro sold off broadly for most of the week: against the U.S. dollar, the euro declined 4 straight days. EUR/USD ended the week slightly below its 50DMA support. It was almost as if the market’s verdict on the official start to Brexit favors the British over the European Union (EU). Yet, I followed through on my initial call and accumulated a long position on EUR/USD for the first time in a VERY long time (let’s see how long I last in this position!). Mainly as a result of euro weakness, the U.S. dollar index rallied all week, but it closed just below its 50DMA. I will be watching closely to see whether, in the short-term, the stock market’s fate stays closely tied to the U.S. dollar’s fate.
The U.S. dollar index rallied with the stock market this week. Like the S&P 500 and the NASDAQ the index fell just short of a major breakthrough – in this case resistance at its 50DMA.
The first quarter of 2017 ended with major indices all sitting at critical junctures: the S&P 500 at its short-term downtrend and 20DDMA resistance, the NASDAQ at its all-time high, and the U.S. dollar index at its 50DMA. The all-important financials are also at an important juncture: the Financial Select Sector SPDR ETF (NYSE:XLF) rallied marginally through the February breakout line and then Friday wavered below it. The resolution of these synchronized junctures SHOULD be explosive – except the market for quite some time now has preferred to deliver mostly in tiny morsels at a time with some rare exceptions this month.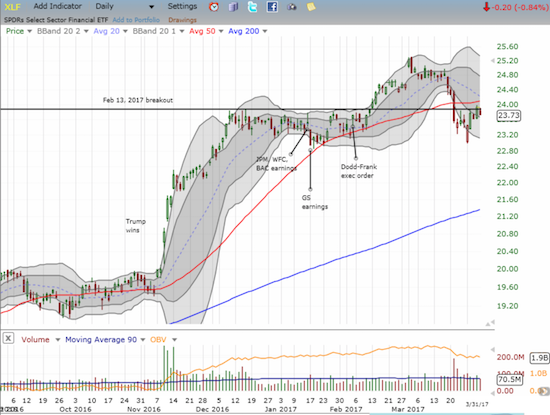
The Financial Select Sector SPDR ETF (XLF) struggled this week to regain former glory above the breakout line from February.
“Above the 40” uses the percentage of stocks trading above their respective 40-day moving averages (DMAs) to assess the technical health of the stock market and to identify extremes in market sentiment that are likely to reverse. Abbreviated as AT40, Above the 40 is an alternative label for “T2108” which was created by Worden. Learn more about T2108 on my T2108 Resource Page. AT200, or T2107, measures the percentage of stocks trading above their respective 200DMAs.
Active AT40 (T2108) periods: Day #281 over 20%, Day #101 over 30%, Day #4 over 40% (overperiod), Day #10 under 50%, Day #22 under 60%, Day #53 under 70%
Black line: AT40 (T2108) (% measured on the right)
Red line: Overbought threshold (70%); Blue line: Oversold threshold (20%)
Be careful out there!
Full disclosure: long SDS, long SSO call options, net long the euro, long and short various currencies against the U.S. dollar index

