Are corporate earnings genuinely wonderful? It may depend on your perspective. For example, after-tax corporate profits have grown at an annualized pace of less than 1% over the last 5 years. You won’t find many 5-year periods that have been as anemic as that.
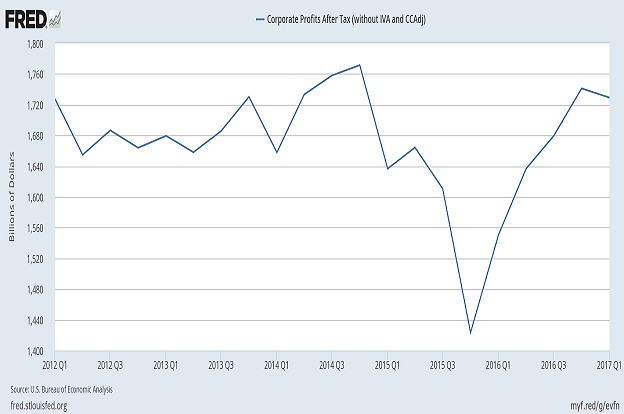
In the same vein, earnings per share (EPS) growth has been equally unimpressive. Yet stock prices have been climbing with or without corporate earnings support.
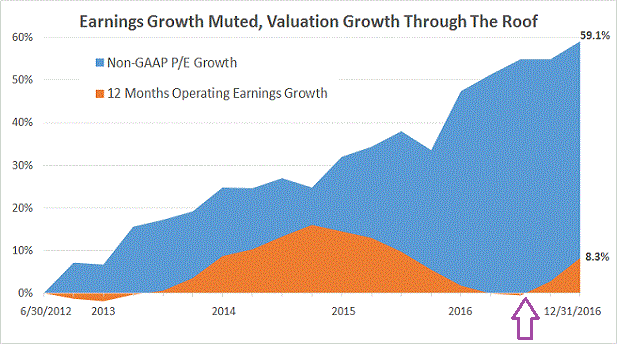
One could make a case that corporate profits are just now hitting their stride. Indeed, one might assert that the only thing of importance is earnings acceleration since the fourth quarter of 2016.
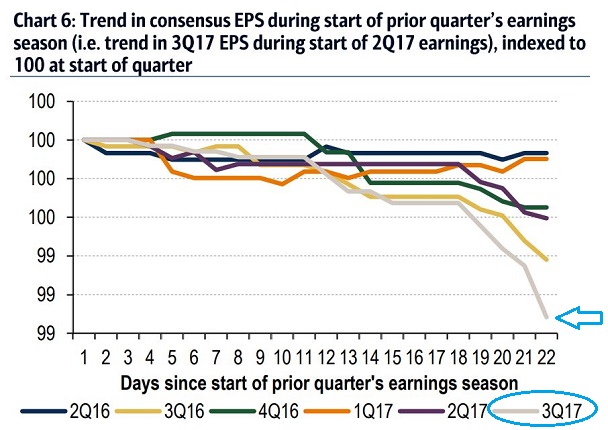
Unfortunately, the notion that things are dramatically improving is a “fish story.” Consensus EPS projections for the 3rd quarter have already been slashed; analyst cuts to estimates have been the largest in two-and-a-half years.
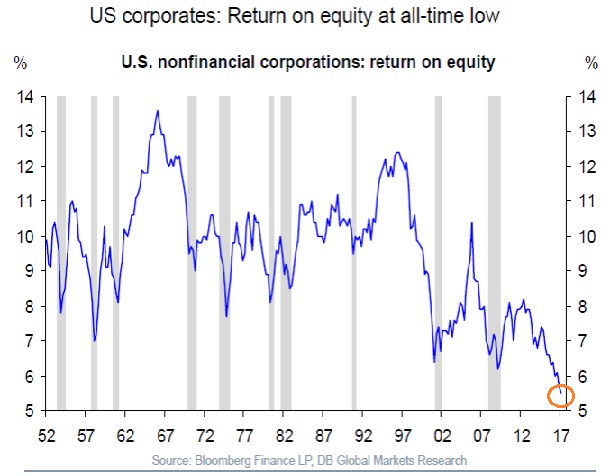
Other measures of corporate profitability demonstrate that a profit explosion to the upside is unlikely. For instance, return on equity, which considers how much profit companies generate with the money that shareholders provide, is hitting post-World War II lows.
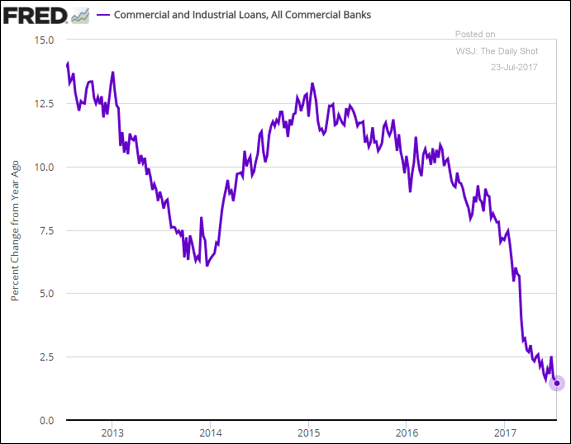
If corporate profitability is really going to improve in the coming quarters, we’d likely need to see an acceleration on the economic front. Credit expansion would need to pick up rather than slow down. Regrettably, in spite of attractive borrowing costs, banks are lending less to businesses than at any point in the current recovery.
Meanwhile, job growth in key regions of the country has slowed to a crawl. Consider the Northern California counties that serve as the epicenter for high-paying tech jobs – San Francisco, San Mateo, Santa Clara, Alameda, Contra Costa and Marin. Every last one of these feeders to the Bay Area and Silicon Valley have seen job growth weaken considerably. (Note: The chart below is for Santa Clara County, which includes Silicon Valley stalwarts like Palo Alto, Sunnyvale and San Jose.)
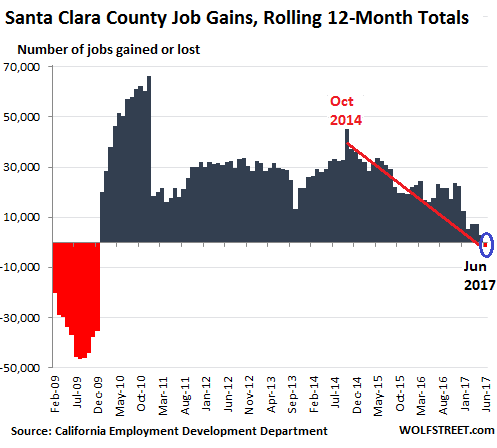
Credit is the lifeblood of an economy, and it is slowing. Job growth is essential to household consumption, and it is decelerating. Even one of the biggest sources of stock price appreciation in the eight-year, four-month, bull market – a source that goes by the name of “stock buybacks” – is losing steam.
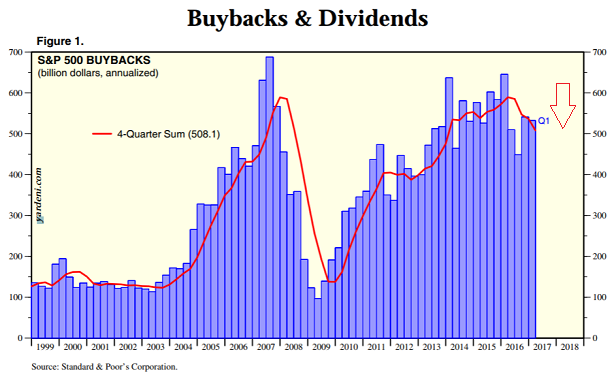
The buyback slowdown may be critical to monitor. Over the past eight years, stock share buybacks have significantly reduced the number of shares available in the secondary marketplace. With less shares available for purchase, companies have made their earnings per reduced-number-of shares appear halfway decent. What would corporate profitability actually look like were it not for the reduction in supply of available shares?
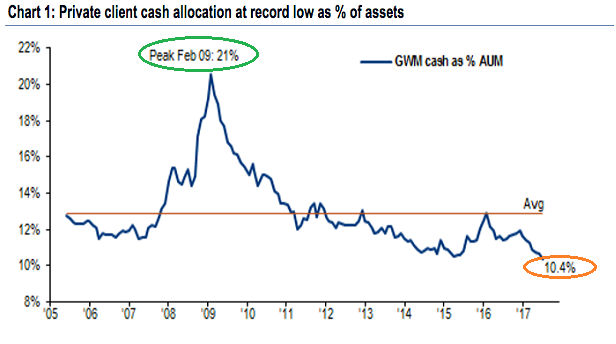
Ironically enough, at a time when economic indicators are not particularly encouraging, where corporate profits are likely to face significant headwinds, the investment herd is showing signs of wayward euphoria. Bullish sentiment at Investors Intelligence rocketed to 57.8% bullish versus 16.7% bearish. Similarly, cash allocations as a percentage of assets are hitting record lows. (Note: It should come as no surprise that when cash allocations hit a peak of 21% in February of 2009, one would have benefited from a generational buying opportunity.)
There’s more. Margin debt, an indication of confidence in bullish price movement, is substantially above 2000 and 2007 levels. Equally compelling? Investor credit balances. The bars in the chart below are green (positive credit balance) when investors are not using leverage; their cash accounts exceed the margin debt and the cash in margin accounts. The bars are red when those cash account cash balances are far less than the sum of the margin debt and the cash in margin accounts. Interestingly enough, investors have never been quite so leveraged or quite so euphoric.
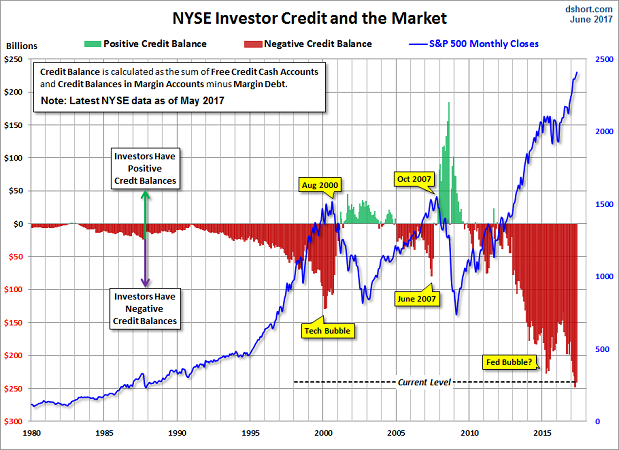
Investor fearlessness. Job growth abatement. Credit growth sluggishness. And corporations that are, in reality, struggling to achieve bottom-line profitability. Do these things constitute a recipe for sustainable stock price appreciation going forward?
Granted, it may not matter at the moment. Central bank liquidity has encouraged excessive leverage, extraordinary speculation and untoward mal-investment. What’s more, the risk of asset values collapsing across the globe has placed the world’s central banks in a stranglehold; that is, they must maintain ultra-easy monetary policies, and they must do so without a viable exit strategy.
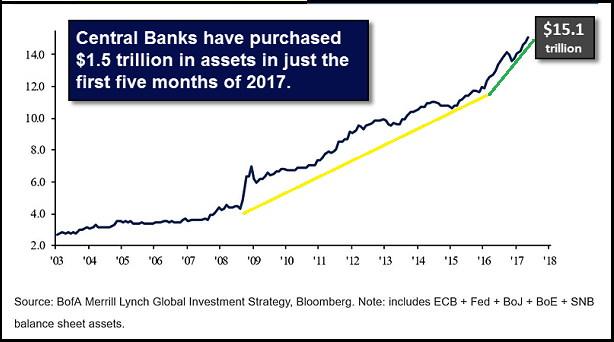
It follows that the biggest risk of losing money in stocks today has little to do with corporate profits. It has to do with the possibility of central bank policy error. Overnight lending rates could be raised too quickly or too slowly; unconventional asset purchases could be liquidated too quickly or too slowly, where the electronic monetary credits created out of thin air could be withdrawn too quickly or too slowly.
The Federal Reserve tightened borrowing costs too quickly in 1937. Even though it had been eight years after the 1929 financial crisis, the actions proved detrimental to asset prices. The Dow logged a -49.1% price evisceration in less than 13 months time.
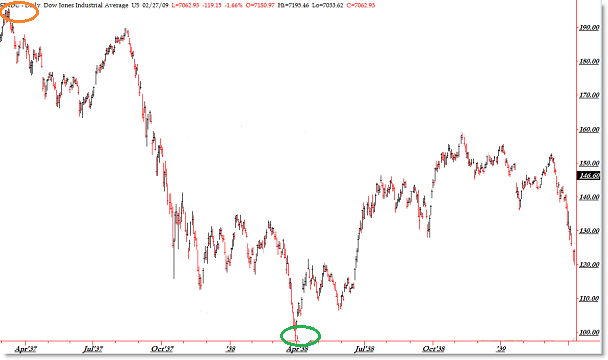
One way or another, the globally interconnected central banking system will make a major mistake. It will do something that jostles investor confidence. Then, policy makers will try to undue the harm via taking a 180 degree turn in the opposite direction. Participants won’t bite. Riskier asset prices will continue to fall. And the notion that central banks can backstop any downturn with endless liquidity injections will fall by the wayside.
It’s not that a 50% bearish outcome is pre-ordained. A bearish retreat of 20%-35% is just as likely as a 35%-50% mauling. Perhaps more so. Nevertheless, there will come a time when seats might not be available to those who played musical chairs for too long.
I continue to maintain the same growth-n-income profile for moderate growth-n-income clients, ever since the end of 2014/start of 2015. Specifically, we are holding 50% high quality equity, 25% investment grade income and 25% cash equivalents.
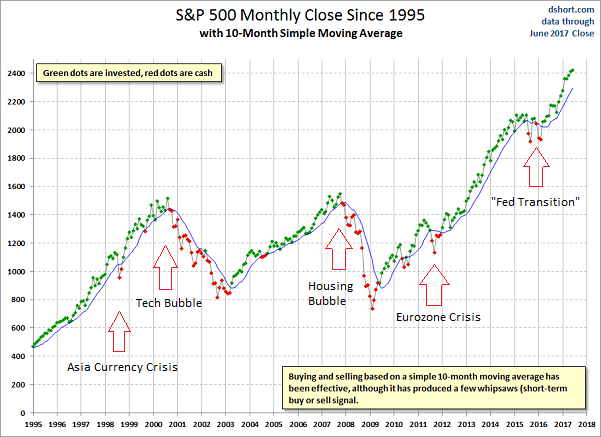
What would it take for me to make a tactical asset allocation decision to reduce stock exposure even further? A definitive weakening of market internals alongside a significant trendline breach. In particular, the NYSE Advance/Decline (AD) Line would need to break down and the S&P 500 would need to close below its monthly 10-month moving average.
Disclosure: ETF Expert is a web log (“blog”) that makes the world of ETFs easier to understand. Gary Gordon, MS, CFP is the president of Pacific Park Financial, Inc., a Registered Investment Adviser with the SEC. Gary Gordon, Pacific Park Financial, Inc., and/or its clients may hold positions in the ETFs, mutual funds, and/or any investment asset mentioned above. The commentary does not constitute individualized investment advice. The opinions offered herein are not personalized recommendations to buy, sell or hold securities. At times, issuers of exchange-traded products compensate Pacific Park Financial, Inc. or its subsidiaries for advertising at the ETF Expert website. ETF Expert content is created independently of any advertising relationship.
