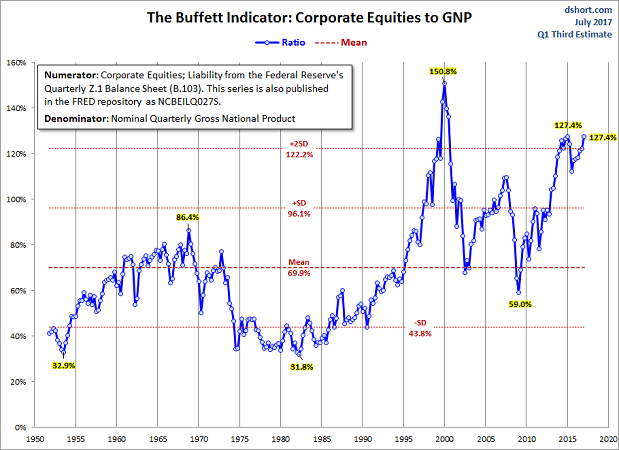
There is a reason why Warren Buffett regarded market-cap-to-GDP as “…the best single measure of where valuations stand at any given moment.” The reason? Its relationship with 10-year forward returns for stock prices. And right now, stock market capitalization as it relates to the U.S. economy is projecting negative returns for U.S. stock prices.
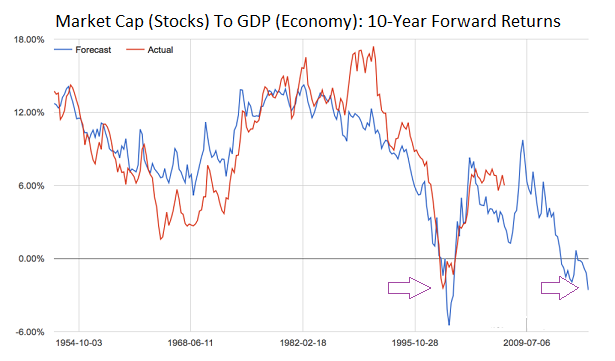
It is also true that Mr. Buffett has, in recent years, distanced himself from the valuation approach called the “Buffett Indicator.” Is it because he stopped believing that valuations matter? Probably not. In fact, the Oracle (NYSE:ORCL) of Omaha is holding onto more cash than at any other quarter in the last decade.
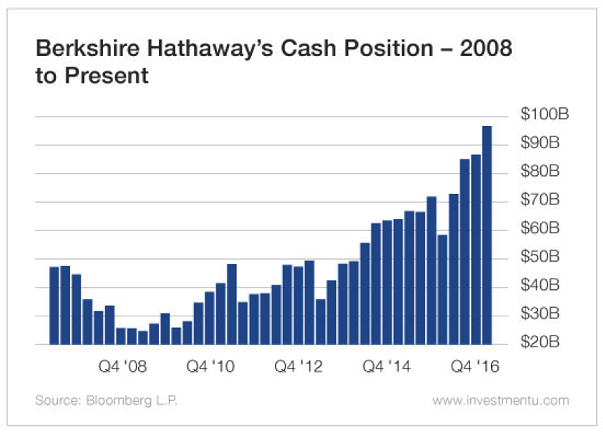
If market-cap-to-GDP is no longer in Warren Buffett’s good graces, do other valuation measures explain why he is holding onto record levels of cash in Berkshire Hathaway (NYSE:BRKa) (BRK.B)? Hard to say. With the exception of tech bubble euphoria, U.S. stocks have never been more expensive on price-to-sales ratios (P/S), price-to-earnings ratios (P/E), dividend yield or Tobin’s Q.
Indeed, market-cap-to-GDP merely confirms what Mr. Buffett knows to be true. The higher the price one pays, the lower one’s return over time. Similarly, the lower the price one pays, the higher one’s return over time.
“But Gary,” you protest. “Nobody can time the market. Even Warren Buffett thinks people should buy-n-hold.”
In truth, Mr. Buffett is a market timer. He buys, sells, rebalances, increases his stakes, decreases his stakes and even completely divests from particular companies according to his discipline. He just does not think that others can time the market effectively.
Maybe he’s right. Maybe they can’t.
On the other hand, “market timing” with nothing more than a 10-month simple moving average and the 10-year Treasury has outperformed buy-n-hold with less risk.
This is worth repeating. Market timing with the 10-month simple moving average has outperformed buy-n-hold over the last 90 years. It has done so on a head-to-head basis. And more importantly for risk managers, it has done so on a risk-adjusted basis via standard deviation and the Sharpe ratio.

To the untrained eye, the head-to-head result for compounded growth might steal the spotlight. It shouldn’t. The real payoff is that the trend-following discipline minimizes portfolio volatility and reduces portfolio drawdown.
In other words, wouldn’t you sleep better at night if the exposure you have to stocks does not suffer as much as the market might suffer in a bearish turn of events? Believe it or not, you could have avoided the bulk of stock market losses from the 2000-2002 tech bubble and the 2008-2009 financial collapse. (Note: My counseling on how to lose less before the 2000 “tech balloon” let me leave the firm that I had been working for to create my own Registered Investment Adviser with the SEC in the early 2000s.) Equally compelling for risk managers, you could have sidestepped 1998’s Asia currency crisis as well as 2011’s Eurozone sovereign debt crisis.
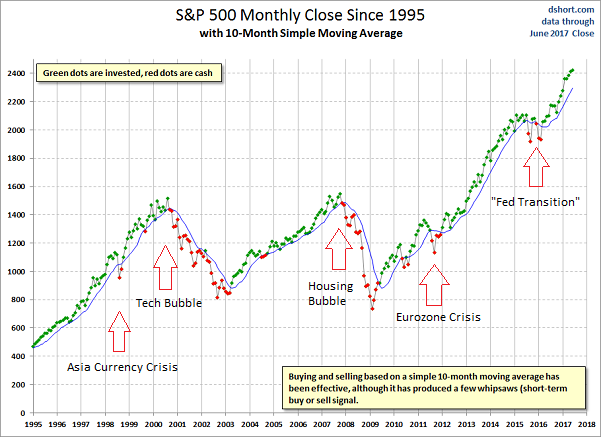
Granted, Meb Faber’s trend-following technique served up a few “whipsaws” in 1999 and 2004. No investing discipline is flawless. Yet even limiting one’s exposure to equities throughout 2015 and during a chunk of 2016 proved more sensible than holding-n-hoping stocks would recover.
Trend-following has always been a big part of how I have managed assets. Being mindful of the 200-day moving average, for example, played an important role in my advising others to lighten up on stocks prior the tech wreck in 2000-2002 and the subprime disaster in 2008.
In the opposite vein, it has played a large role in my maintaining at least a 50% allocation to stocks for my moderate growth-n-income client base. Granted, I lowered that allocation from 65%-70% to 50% on a weakening economic backdrop, a shift in Fed monetary policy toward tightening as well as fundamental overvaluation hitting 2-sigma extremes. Nevertheless, the technical picture is undeniably favorable such that, according to my discipline, 50% equity exposure is still warranted.
The gods know, I have taken a great deal of heat from several anonymous content providers for a tactical asset allocation shift toward slightly less equity exposure. Even though my clients are primarily retirees and near-retirees. Even though job growth as well as GDP has been slowing. Even though Grantham Mayo Van Otterloo & Company (GMO) researched 40 bubbles and discovered that asset prices reverted back to long-term averages in EVERY “two standard deviation” occurrence (a.k.a. “bubble”). Even though a two-sigma extreme exists right now, and it exists across nearly every valuation measure one can conjure up.
Like ‘sheeples,’ detractors consistently battle my observations on three fronts: (a) market timing is ‘stupid’, (b) low rates justify endless price appreciation, and (c) current prices at record highs prove that different opinions are worthless. In this article, I demonstrated how market timing has been effective for disciplined trend-followers. Meanwhile, in countless previous commentary, I demonstrated how similar ultra-low rates for a 20-year period (1935-1954) did not prevent four painful bear markets (-49.1%, -23.3%, -40.4%, and -23.2%). And traditional valuation metrics in that period were HALF what they are today.
Do record highs for the primary benchmarks at this moment invalidate my opinions on managing risk? I will say it once more, the higher the price one pays for an investment today, the lower the long-term future return. There are 150 years of data to back that up.
More critically, the massive amount of debt accumulation does little more than rob future investment gains to bring them into the present. The future is certain to see a reversion toward economic growth itself.
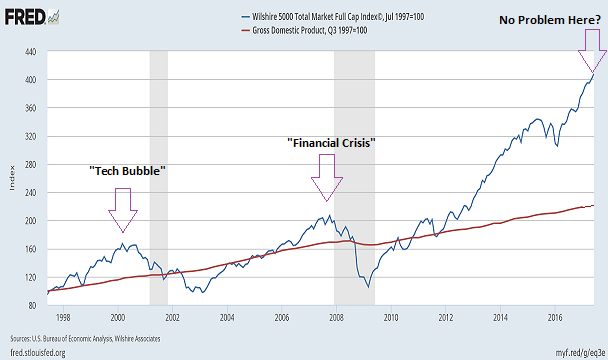
Perhaps obviously, there are a number of ways that asset prices and GDP can get back in sync. Stocks could grow at a slower pace than GDP, allowing GDP to “catch up” over a long period of time. Or stocks could stagnate for many years without a big downturn while GDP chugs along.
More likely, however, stock prices would have to fall somewhat precipitously to come into contact with GDP growth. And if there’s a recession with GDP data, that would imply a more dramatic fall for stock prices to realign with the long-term GDP trend.
I am not saying that everything in the world must go to pieces or that a crash is inevitable. A bear market is inevitable, but a crash is not.
I am saying that people are taking far too much risk in relation to their reward prospects. That may work for awhile. That may appear beneficial for months or a few more years. Still, a running tally of political dysfunction, peak credit/slowdown in bank lending, terrible fundamentals, slowing economic trends across job growth and GDP and the possibility of central bank tightening do not scream, “Buy, buy, buy!”
What does tell one to buy more? Or at least hold onto what they’ve got? Favorable technicals. As long as those remain, it is likely that I will remain committed to a 50% stock allocation, 25% investment grade income allocation and a 25% cash equivalent allocation. Some of those cash equivalents yield near 1.5% right now.
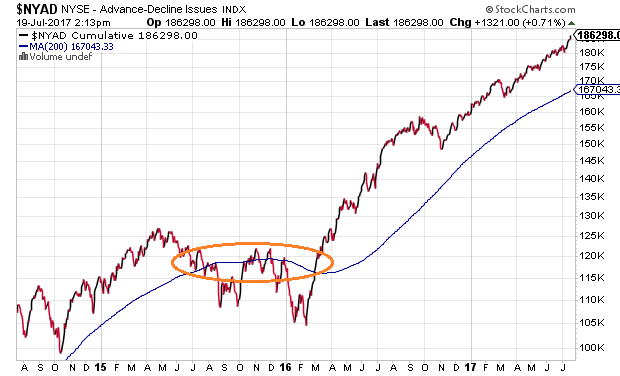
What might cause me to reduce stock exposure further? If the S&P 500 fell below its 200-day MA and/or 10-month SMA. In the same vein, a breakdown in market internals such as the NYSE Advance Decline Line (NYAD) would require my attention.
Disclosure Statement: ETF Expert is a web log (“blog”) that makes the world of ETFs easier to understand. Gary Gordon, MS, CFP is the president of Pacific Park Financial, Inc., a Registered Investment Adviser with the SEC. Gary Gordon, Pacific Park Financial, Inc., and/or its clients may hold positions in the ETFs, mutual funds, and/or any investment asset mentioned above. The commentary does not constitute individualized investment advice. The opinions offered herein are not personalized recommendations to buy, sell or hold securities. At times, issuers of exchange-traded products compensate Pacific Park Financial, Inc. or its subsidiaries for advertising at the ETF Expert website. ETF Expert content is created independently of any advertising relationship.
