Greetings from St. Louis. It’s my first time here, but my impressions are (a) things are a whole hell of a lot cheaper (b) every billboard is occupied by a personal injury attorney advertisement (c) they don’t believe in signal-based traffic lights, preferring instead the timed ones.
As occupied as I am with weekend stuff, I wanted to get out another post about – of all things – U.S. equity markets.
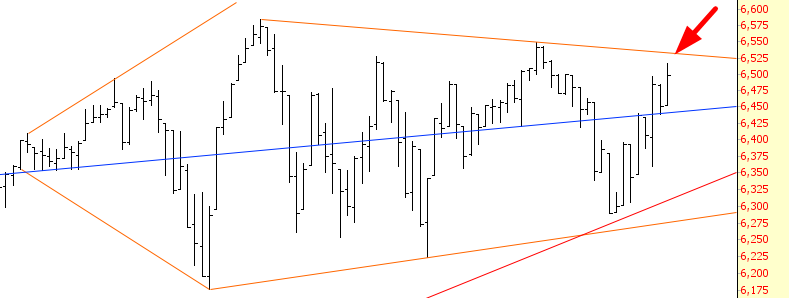
The Dow Jones Composite continues, in its fifth month, to go positively nowhere. God forbid we break out above this pattern, but – – well – many things have happened over the past six years without permission of the Almighty, so why should this be any different?
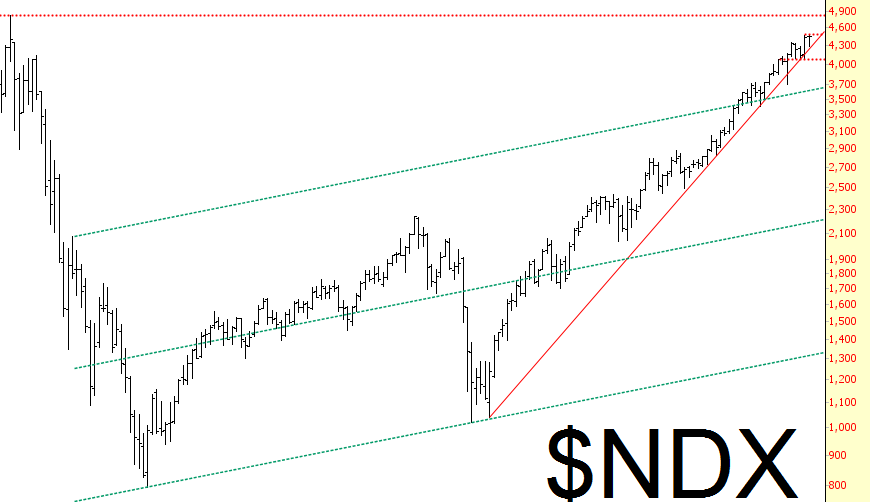
The NASDAQ Composite is less than 2% away from its Sock Puppet Lifetime High set in 2000, although the NASDAQ 100 isn’t quite as close. It’s getting there, though…(I’m using a monthly chart below, since this better shows 20 years):
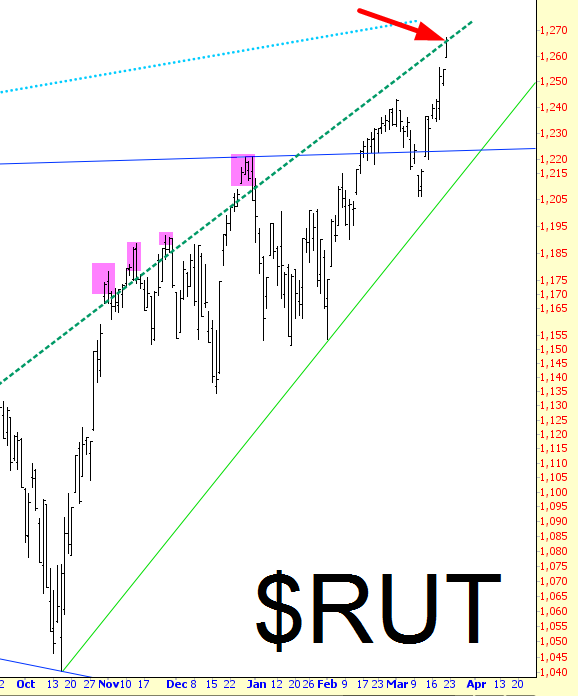
The small caps, as represented by the Russell 2000, are mashed up against its resisting trendline. I know how giddy my bullish friends are right now, but I’d like to gently point out, via the magenta tints below, that recent history has not been kind to bulls at similar levels. The trendline might get violated briefly, but it tends to act as, well, resistance.
Dow Transports are still looking decent on the bear side, although “bear-ly” (heh). Lower highs continue….
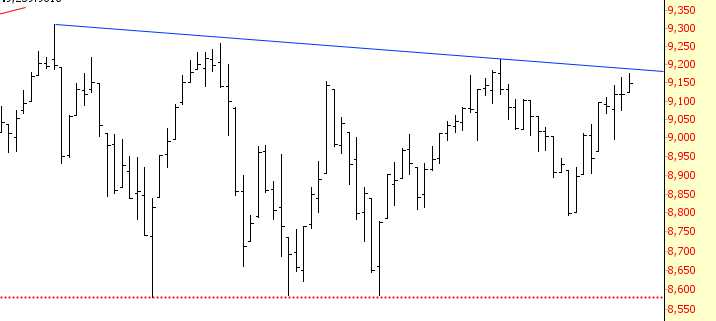
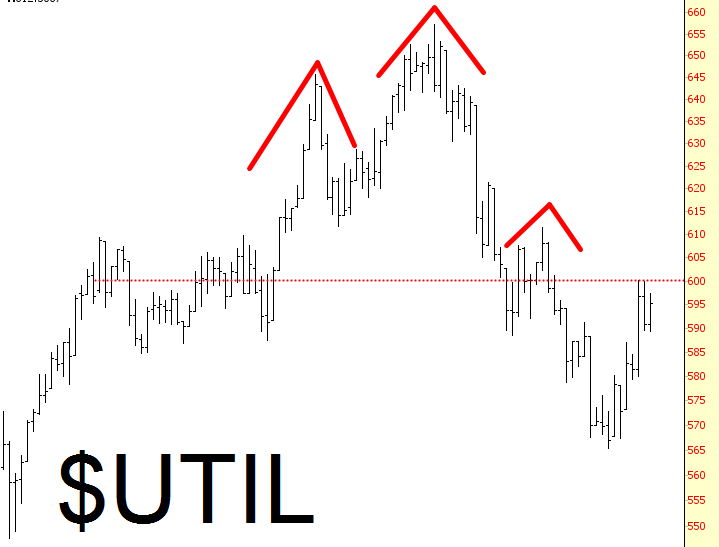
And the Dow Utilities look even more promising for a resumption of weakness.
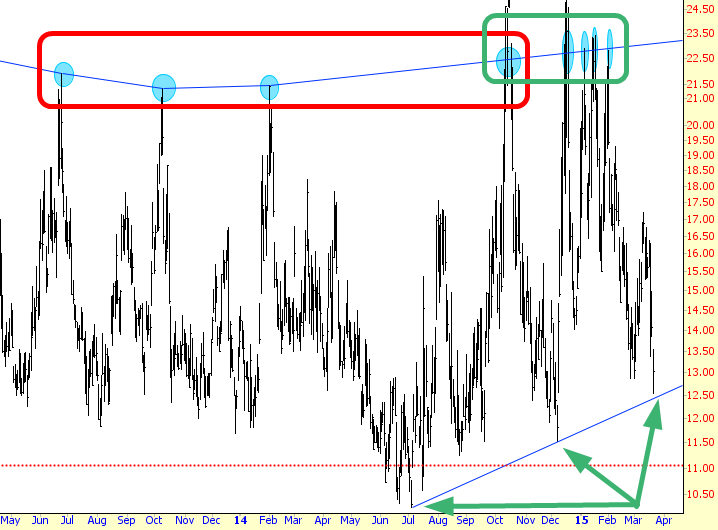
The oddest thing is the VIX. For a long, miserable while, we would go for many months between each exciting “spike” in volatility (I’ve emphasized this in red, and I’m leaving out a lot of prior history). More recently, these spikes got deliciously frequent (green rectangle), but we’ve had a horrible dry spell since February 2, and it stinks! C’mon, boys! We’re back at the supporting trendline. Let’s get this market back on the bear track it so richly deserves!
