A great deal of attention has been paid to the Federal Reserve’s balance sheet expansion and its potential correlation with the rising value of stocks. However, there are signs suggesting that the narrative for the stock market’s advance as a direct result of the balance sheet expansion may be false.
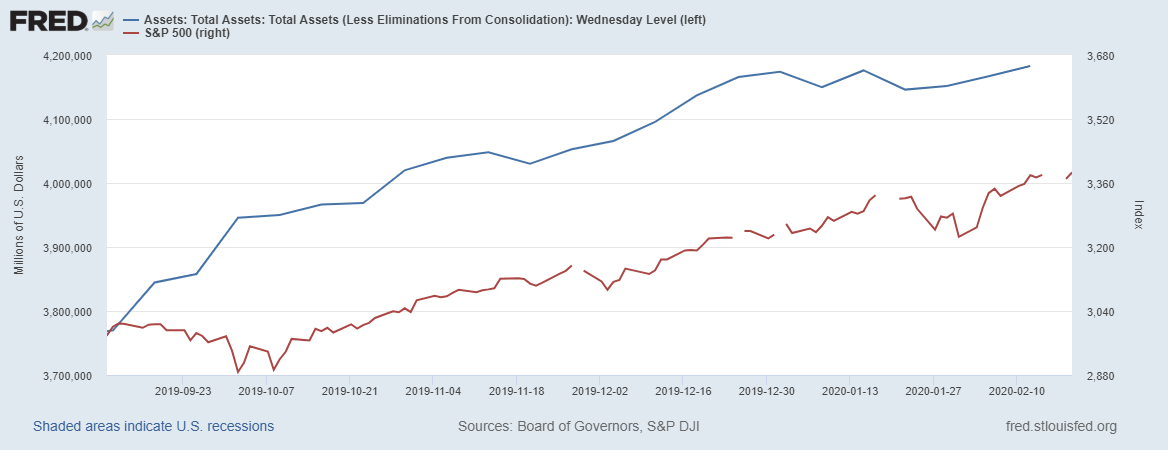
For example, in 2020, the S&P 500 has climbed by approximately 5%, while the Fed’s balance sheet has expanded by roughly 20 basis points.
Perhaps it isn’t so much the Fed’s balance sheet that's driving stocks higher, but rather the monetary policy itself. Remember, it was at the Fed’s meeting at the end of October, that Chairman Powell signaled what could have been interpreted as a lower for longer policy when he tied future rate hikes to a significant rise in inflation.
In a low-interest-rate environment—which appears to be the case for the foreseeable future—coupled with expectations for future earnings growth, one could even argue that stocks still have further to climb.
Flattening Out
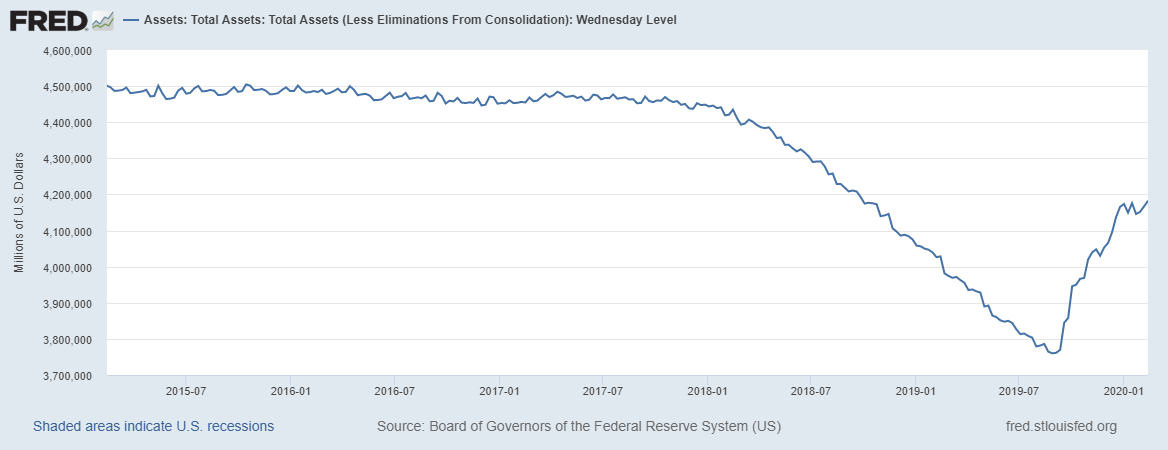
From the looks of the latest data through Feb. 12, the Fed’s balance sheet has been relatively steady. In fact, on Jan. 1, the balance sheet had assets of $4.17 trillion; as of Feb. 12 it was $4.18 trillion.
Further, during that time, the balance sheet had a period of contraction, during which it declined to as low as $4.14 trillion. While it may continue to expand going forward, it appears the Fed’s balance sheet has moved sideways for the past six weeks.

Going back further and comparing, one can see that after the balance sheet initially began to rise, the S&P 500 traded lower from Sept. 11 through Oct. 8. This despite the Fed’s balance sheet increasing to approximately $3.95 trillion from $3.77 trillion over the same period.
It does seem ironic that during a time when the Fed’s balance sheet increased by almost 5%, the benchmark index fell by nearly 4%. Conversely, at the start of 2020, when the S&P 500 gained nearly 5% the Fed’s balance sheet increased by just 20 bps.

Fundamental Underpinnings
There could be an alternative theory that might explain why stocks have been rising, which has to do with the low-interest-rate environment and earnings growth.
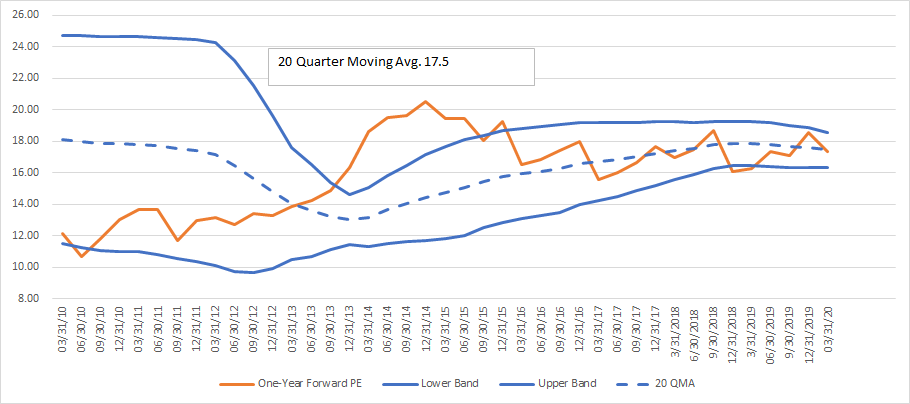
At its current level, the S&P 500 is trading at roughly 17.4 times 2021 earnings estimates of $194.65. Based on current data from S&P Dow Jones, earnings for the index are forecast to climb by 11.6% in 2020 and by 11.9% in 2021.
Low Rate Environment
Over the past 20 quarters, the average S&P 500 one-year forward P/E ratio is 17.5, with a one standard deviation range of 16.4 to 18.6. In the low-interest-rate world, where the Federal Reserve has indicated it supports a lower for longer monetary policy, perhaps multiple expansion to the upper end of the P/E range is reasonable.
At a P/E ratio of 18.5 times 2021 earnings estimates, the S&P 500 would trade for roughly 3,620, about 6.2% higher than its current value on Feb. 12.

(Compiled using S&P Dow Jones Data)
Perhaps it isn’t the rising balance sheet driving the stock market higher; rather, it could be the three rate cuts and signals from the Fed that rates aren’t rising anytime soon. Then factor in a market that's trading around a fairly valued range, with expectations for steady earnings growth over the next two years and it creates a recipe for a stock market poised to rise. Also, the U.S. economy is doing well, with the Atlanta Fed GDPNow forecasting 2.6% first quarter growth.
Overall, stocks are rising. It's just as easy to say that's a result of a low rate world, earnings growth, and multiple expansion, as it is to say it’s because of the Fed’s balance sheet.
