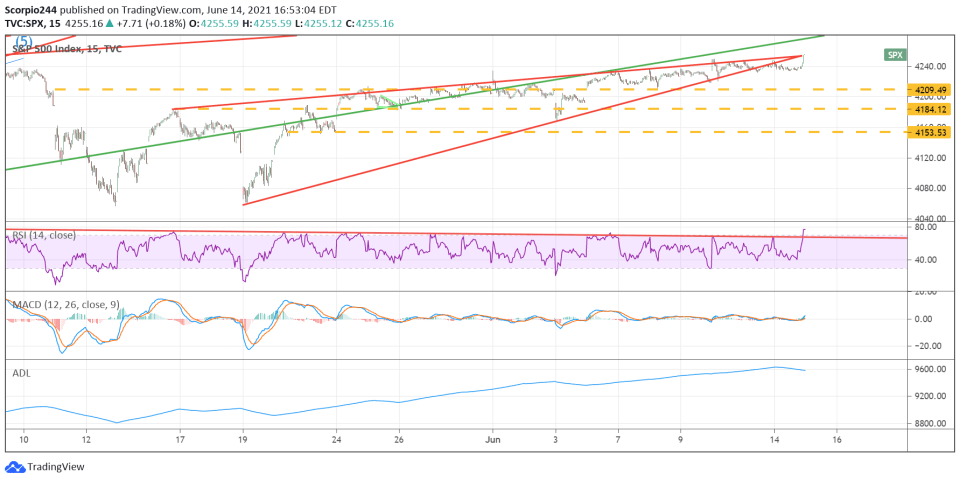
Stocks finished the day with the S&P 500 up 18 bps. The index was down most of the day as investors continued to move out of the reflation trade. The index managed to rally in the final 20 minutes of trading, but other than that, there was nothing to speak of for the index level.
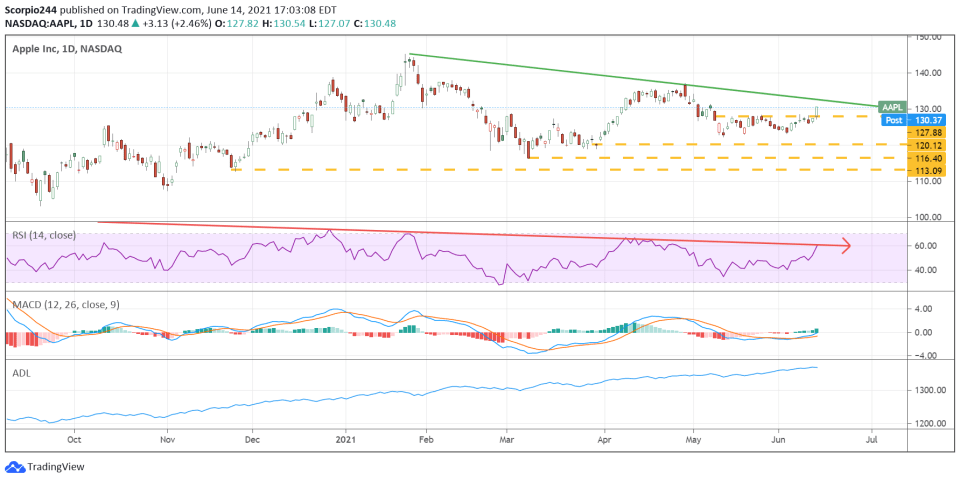
It seems as if the technology rotation was barely strong enough to help offset the decline in the reflation asset. But Apple (NASDAQ:AAPL) appeared to do most of the heavy lifting.
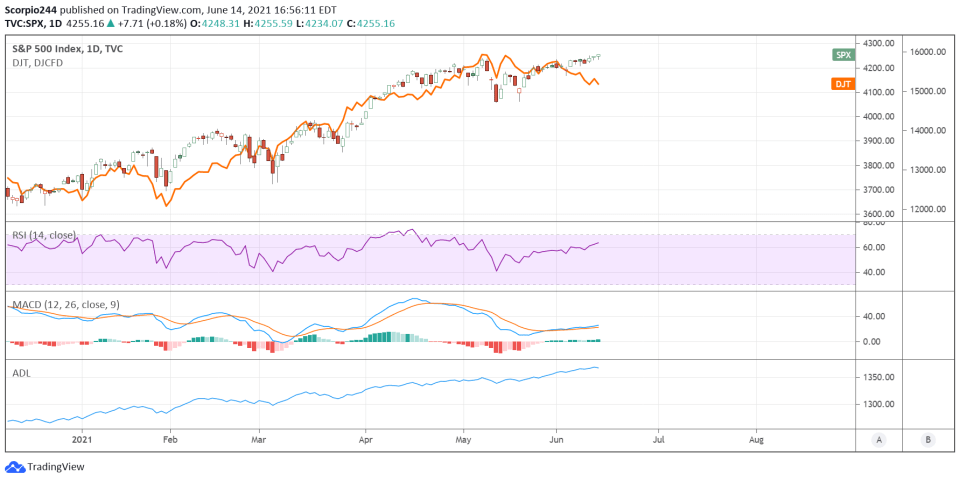
Typically, a rising wedge pattern breaks lower, and at first, the S&P 500 did break lower. But it came back hard in the final 20 minutes, and that allowed it to retest the trend line. The rising wedge in the housing and financial stocks broke lower as they are supposed to, already. But I can’t speak to where the S&P 500 will go from here because the rotation was back into some growth stocks.
Apparently, not all growth stocks benefited. Usually, when we see this big advance higher in the final minutes of trading, they are reversed right on the open. So we will find out tomorrow. But with the Fed and Quadruple witching on Friday, the overall broader index will be difficult to predict this week, and outside of the pattern, there is nothing else to go on.
Transport
The Dow Transport was down more than 6% from their high, with the divergence between it and the S&P 500 growing larger since the beginning of June.
Housing
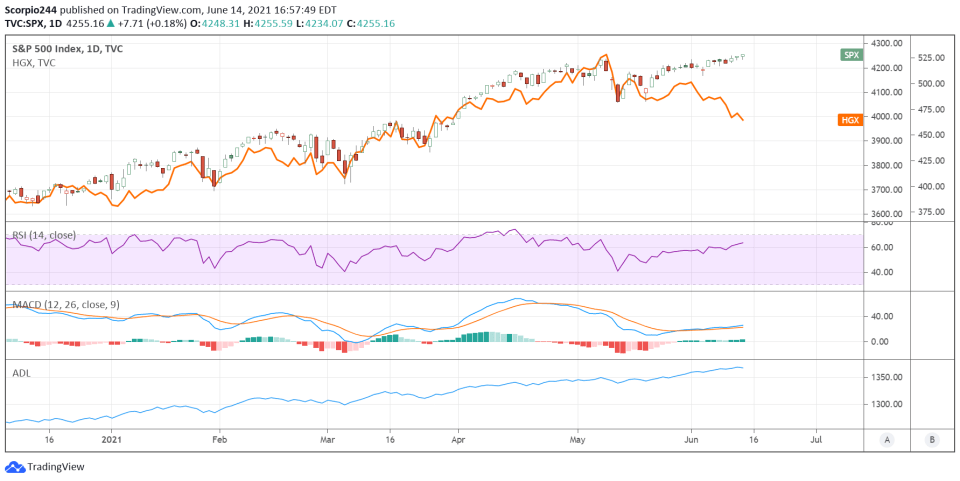
Meanwhile, the housing sector was down again, and down nearly 14% from its peak. So again, the divergence here is growing larger. It reminds me a lot of 2018, but that doesn’t mean the outcome will be the same. I would pay close attention to this.
Financials
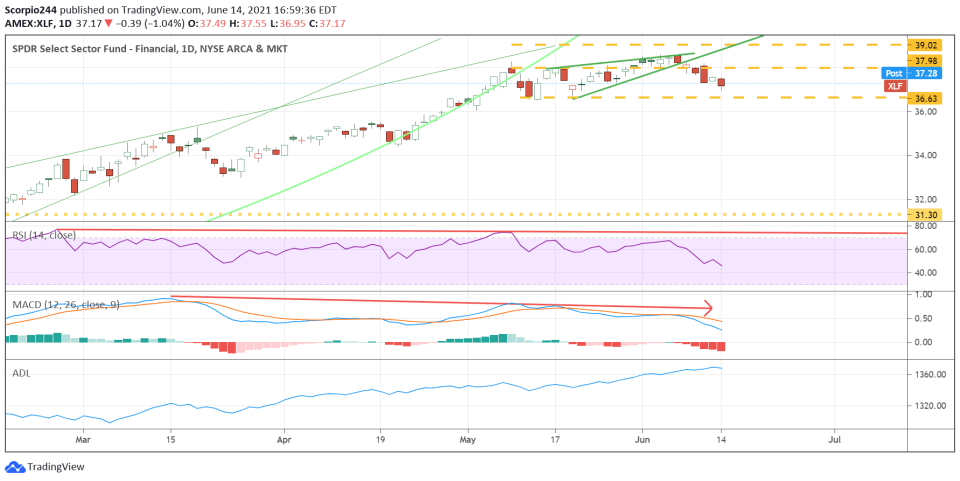
The rising wedge in the Financial Select Sector SPDR® Fund (NYSE:XLF) ETF broke the other day, and we are still waiting to see if $36.60 comes into play.
Apple
I mentioned yesterday that Apple had some bullish trends, but it wasn’t likely to last too long. Apple surged to $130.50 Monday. The trend line is the problem. If the trend falls, then Apple can really run higher. The RSI has clearly been trending lower, indicating a loss of momentum.
Netflix
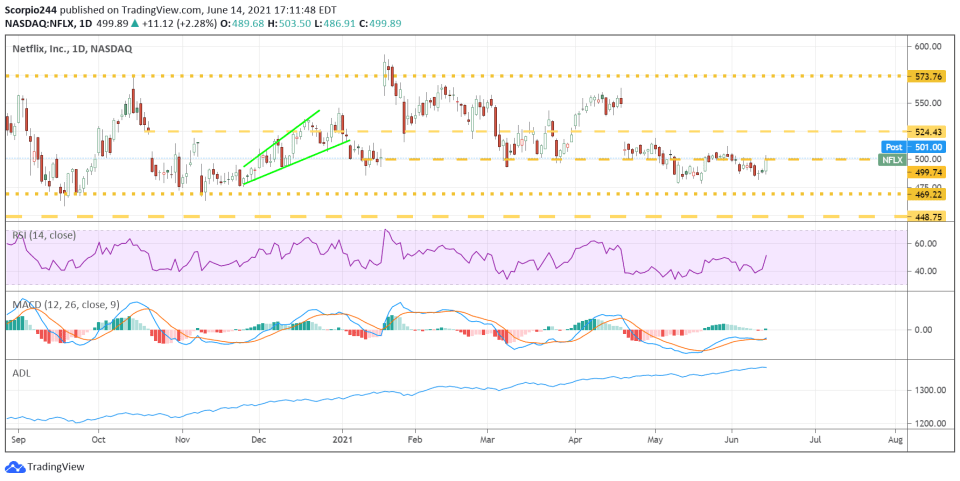
There was a notable rise in some of these stay-at-home stocks on Monday, with the likes of Netflix (NASDAQ:NFLX) rising by 2.5%. Maybe there is nowhere else for people to go; maybe the 4 extra weeks of lockdown in the UK contribute. Nevertheless, there is a gap to fill at $550, and if it should rise above resistance around $500, then $550 could be the next stop.
Zoom Video
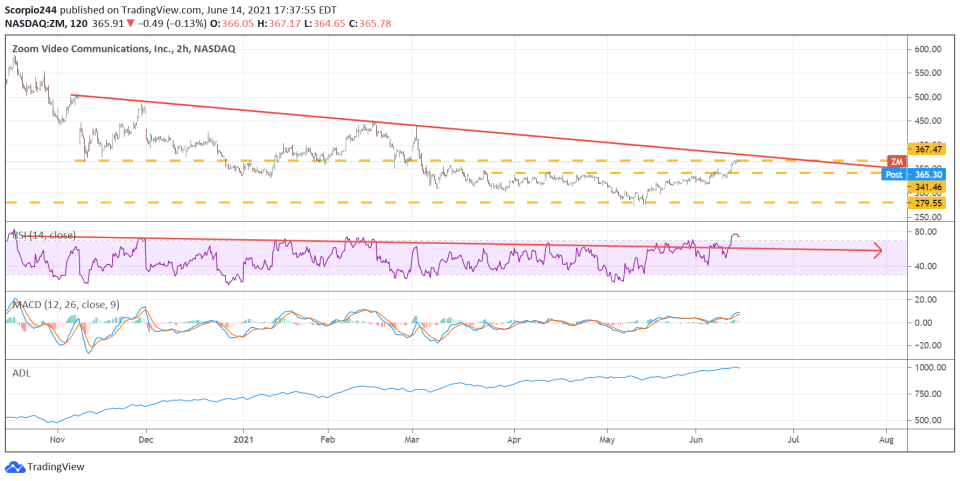
Zoom Video Communications (NASDAQ:ZM) did not rise yesterday, which was more than odd, given the performance of various stay-at-home stocks. There was a big downtrend and resistance between $365 and $370. Nothing else matters for Zoom.
Freeport
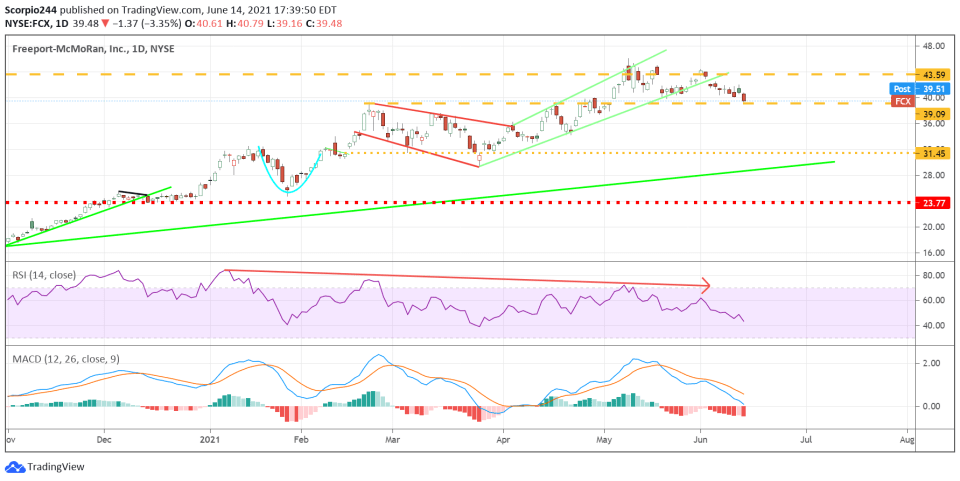
Freeport-McMoran Copper & Gold (NYSE:FCX) was down over 3% Monday. The stock has been weak, and a drop below $39 would trigger a much larger sell-off.

