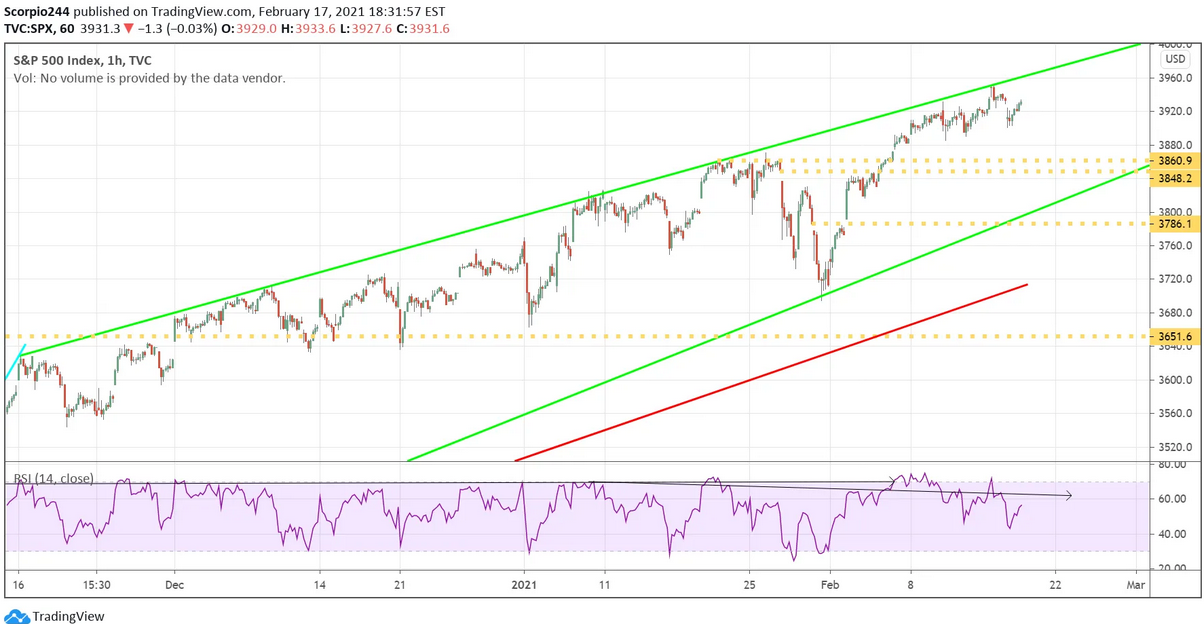
Strange day for stocks with the market dropping sharply at yesterday's opening following the hotter than expected producer price index. However, the S&P 500 managed to grind higher all day, filling the gap produced at the opening to finish lower by 3 bps and close at 3,931.
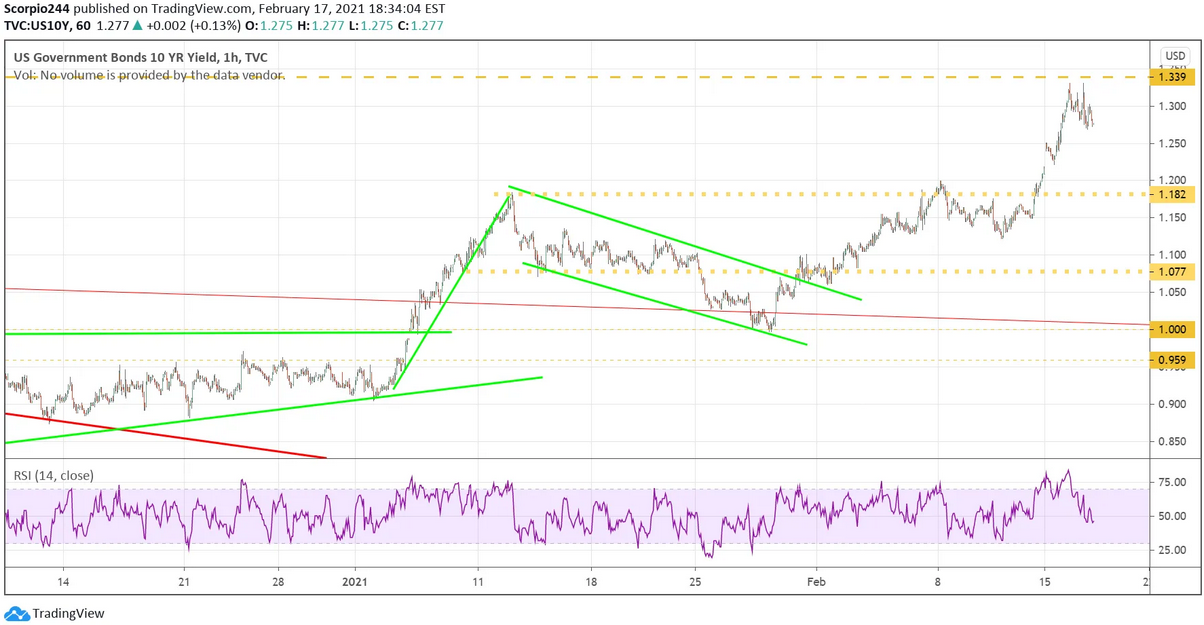
The rates on the 10-year had climbed to around 1.34% yesterday, which was the 2016 low. It would not be surprising to see some consolidation around this 1.3% level, or even a pullback and a retest of support around 1.2%.
Meanwhile, the VIX finished just a touch higher at 21.5 after rising as high as 23.4 Intraday.
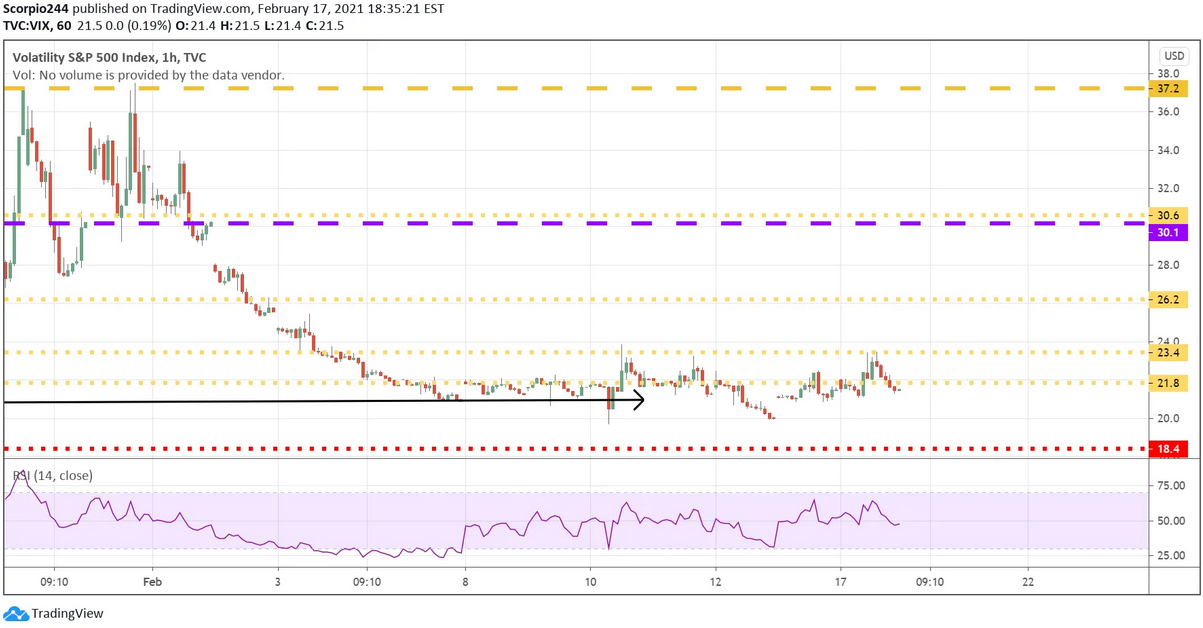
I still believe that S&P 500 is at the top of the range, and the next likely move for the S&P 500 is lower, filling the technical gap at 3,780. The VIX continues to hold on to its trading range of 20 to 22, and I believe that will not change.
It will take a spike in the VIX to give the S&P 500 the fuel it needs to push through 3,950. Additionally, option expiration is this Friday. It seems likely that time decay in calls will force market makers to lighten up some of the there hedged positions, potentially weighing on stocks overall.
Fed Minutes
The Fed also noted that it was more than happy to let things run very hot in the minutes released yesterday. My takeaway is that what the Fed will consider inflation and what the market considers inflation will be two different things. But those rising lumber prices, which are due to supply constraints, are not considered inflationary. Read the text of the minutes:
"In that context, participants emphasized that it was important to abstract from temporary factors affecting inflation—such as low past levels of prices dropping out of measures of annual price changes or relative price increases in some sectors brought about by supply constraints or disruptions—in judging whether inflation was on track to moderately exceed 2 percent for some time."
So only time will tell how the market responds to this. I can tell you from experience markets do not like the risk of runaway inflation rates, and what the market considers to be inflation, well, is up to the market.
Oil
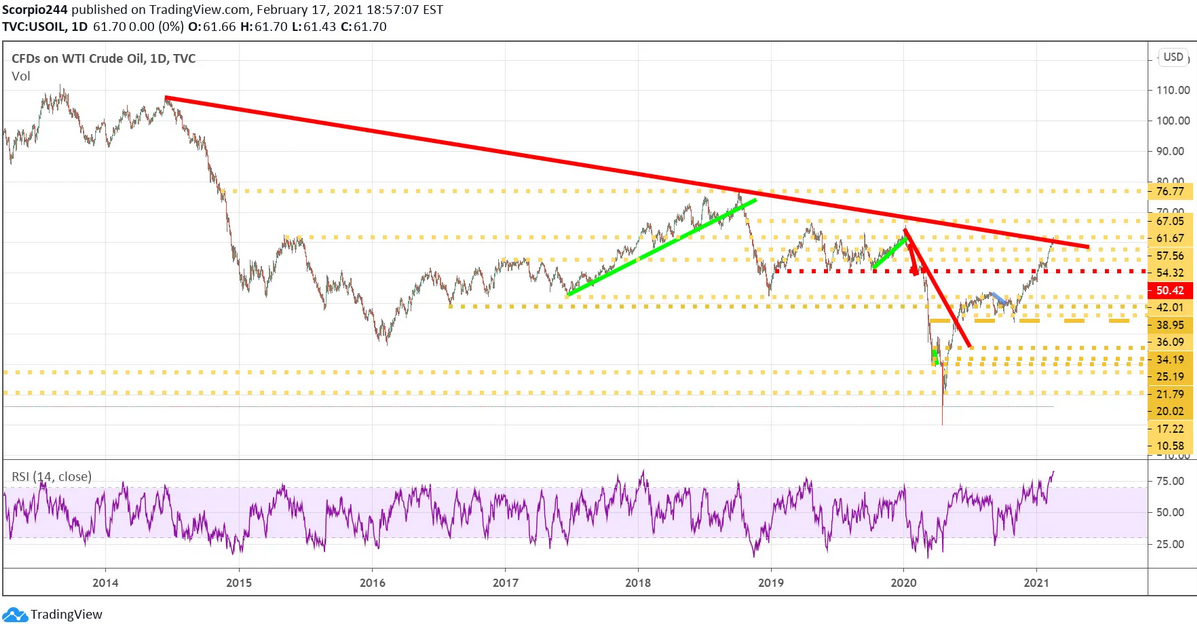
Oil is in an extraordinary place, hitting up against resistance around $61.68 and a big downtrend, going back to late 2014. A failure at this level could be pretty big, with crude easily falling back to around $54.
Exxon
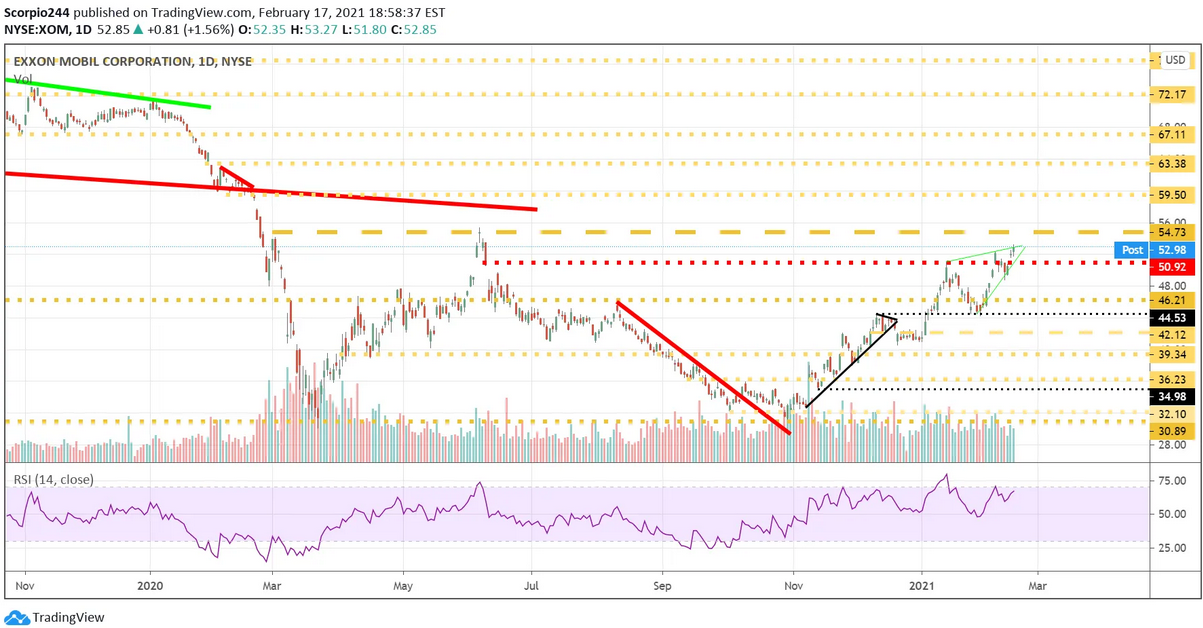
It makes the rising triangle in Exxon (NYSE:XOM) potentially damaging, with a reversion to $46.20 possible.
Apple
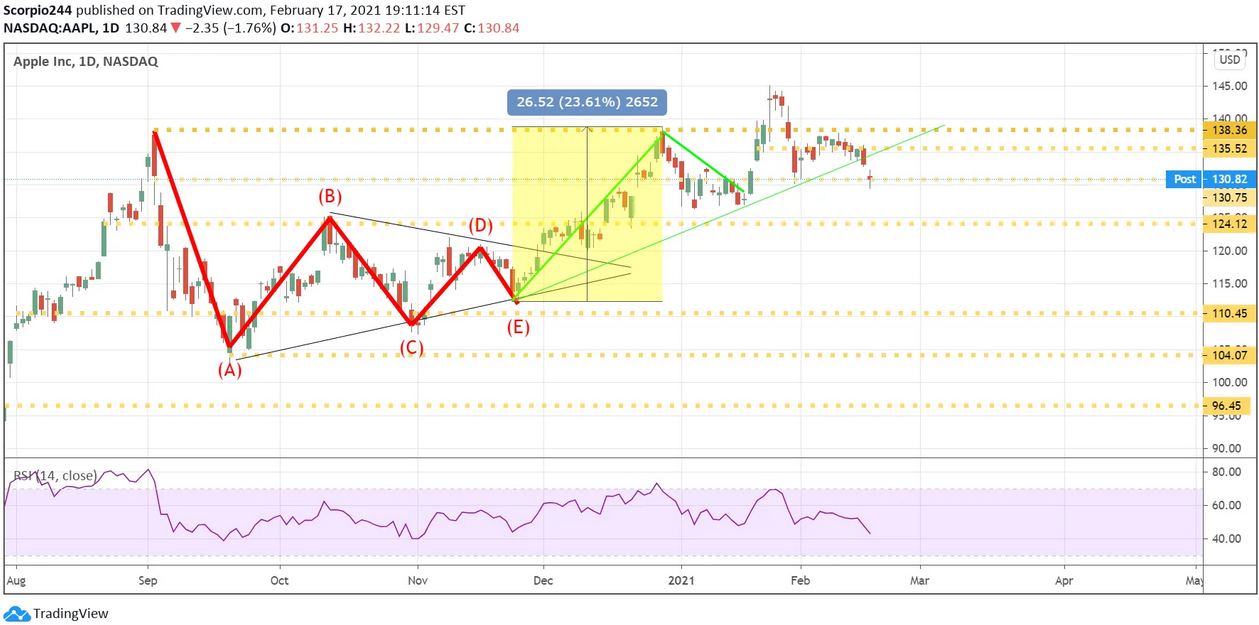
Apple (NASDAQ:AAPL) dropped to support around $130, with the next level to watch for around $127. The uptrend in the stock is broken, and as I noted last week, there was a sizeable bearish bet on the stock.
Walmart
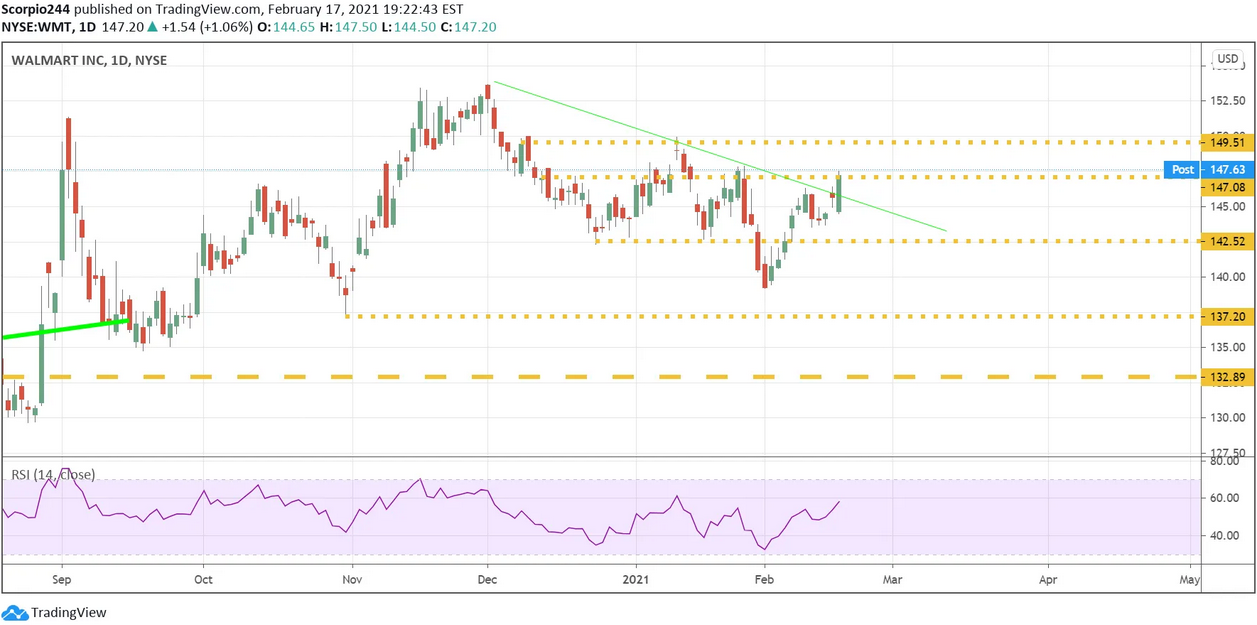
Walmart (NYSE:WMT) looks like it may be breaking out after passing the downtrend and resistance at $147. A push above that level could make the stock go higher to around $150, and preferably back to its highs of around $153.
