Stocks finished the day yesterday higher after a volatile session following the FOMC announcement. The S&P 500 was down nearly all day as rates rose on the 10-year Treasury, but that changed after the Fed announcement.
The Fed’s statement and guidance were in-line with what they had been saying all along—they plan to let the economy run hot and not raise rates until they reach their outcome-based goals.
Equities took this as a cue to rally, and they did, with the S&P 500 finishing the day higher by 30 bps, to close at roughly 3,975. This continues to be the upper end of my range; I have been using the futures, saying a range of 3950-3960, the futures were trading at 3,962 at the close.
I am not surprised that the market rallied on the news; in fact, I pretty much said the Fed would move to appease the equity market and that stocks would likely rally. But this is a sign that Fed Chair Jerome Powell wants the economy to run hot, and Powell is all but daring the bond market to push rates even higher, and the bond market may take him up on that.
Dollar
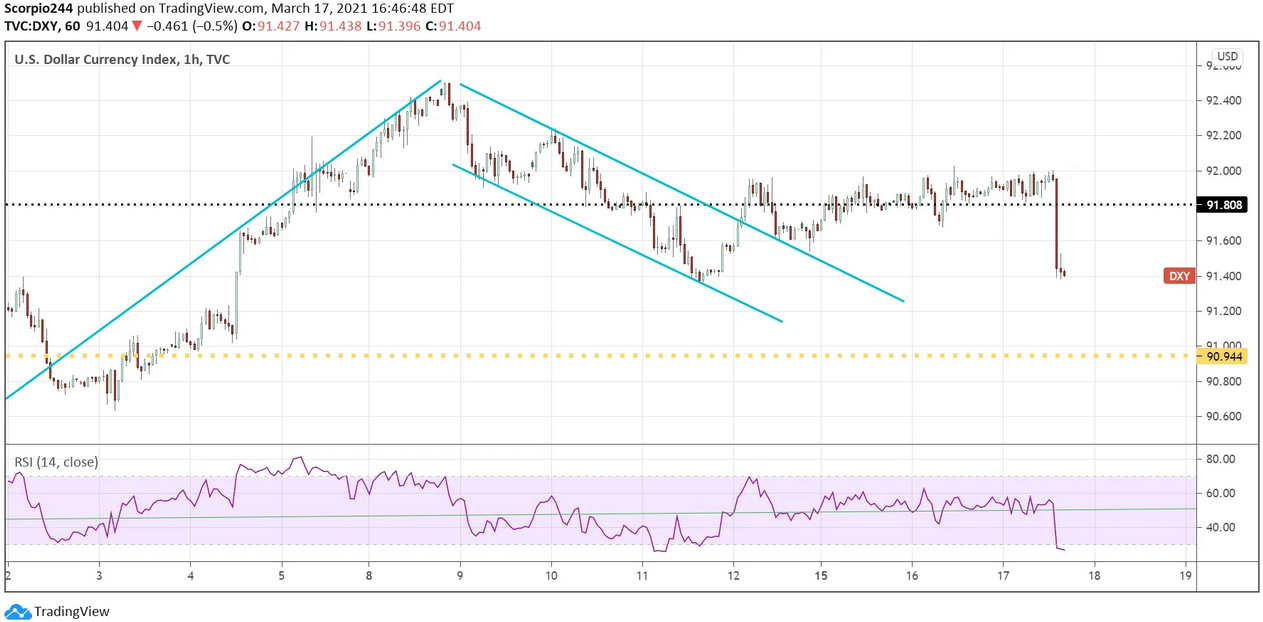
The US dollar is clearly worried about inflation, as it plunged today after the announcement, dropping all the way back to 91.50 on the dollar index.
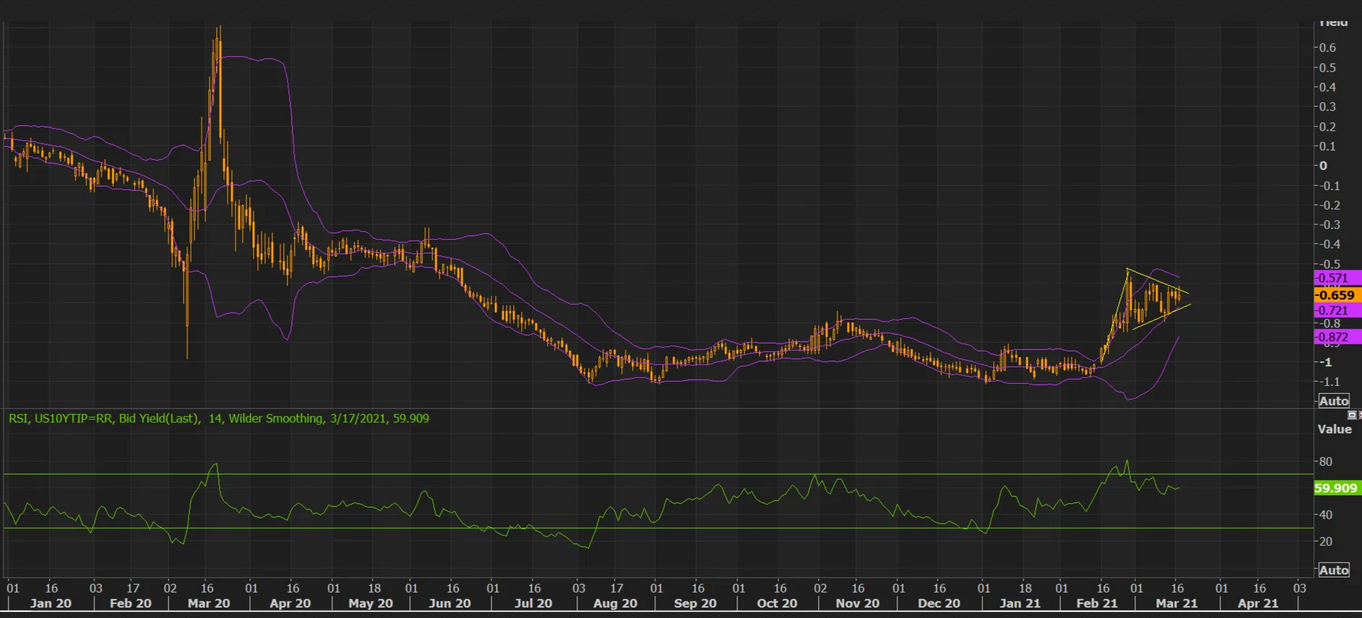
I sense that rates on the long-end have much further to climb, even if there is no inflation or low inflation. After all, Tip yields are still negative 65 bps; they had only traded this low one other time back in 2012. It would seem at this point we are not likely to enter a deflationary period.
I don’t see why the 10-year TIP yield can’t push back to say 0%, which would imply that the 10-year rises to around 2%, maybe 2.25%. I don’t see why the 10-Year TIP should continue to trade at a negative rate when the Fed targets a PCE to start coming in north of 2%.
The chart on the 10-Year Tip would suggest higher rates are likely coming.
The thing is, on the surface, it is hard to see how higher rates have already started to play out in the equity market, but they have. Just look at any of your favorite growth or technology stocks; most are down significant amounts.
NASDAQ 100
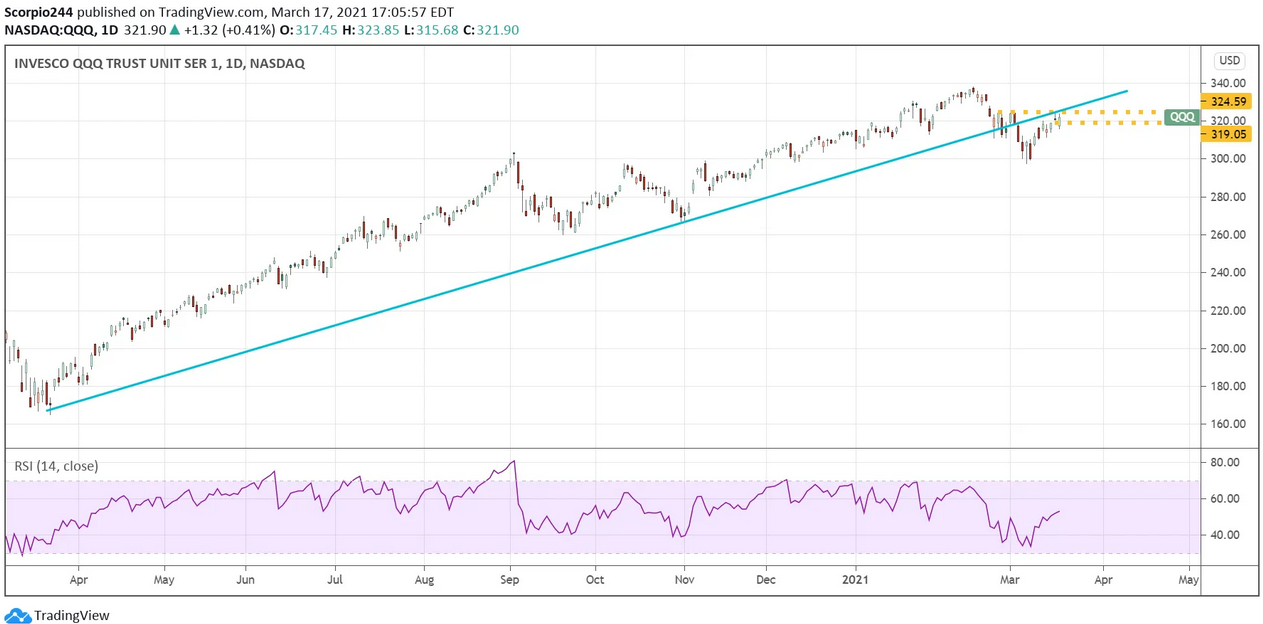
The NASDAQ 100 Invesco QQQ Trust (NASDAQ:QQQ), to this point, has been unable to push back above their March 2020 trend-line. There was a test yesterday and another attempt today, but it failed. I would not positively view that.
Disney
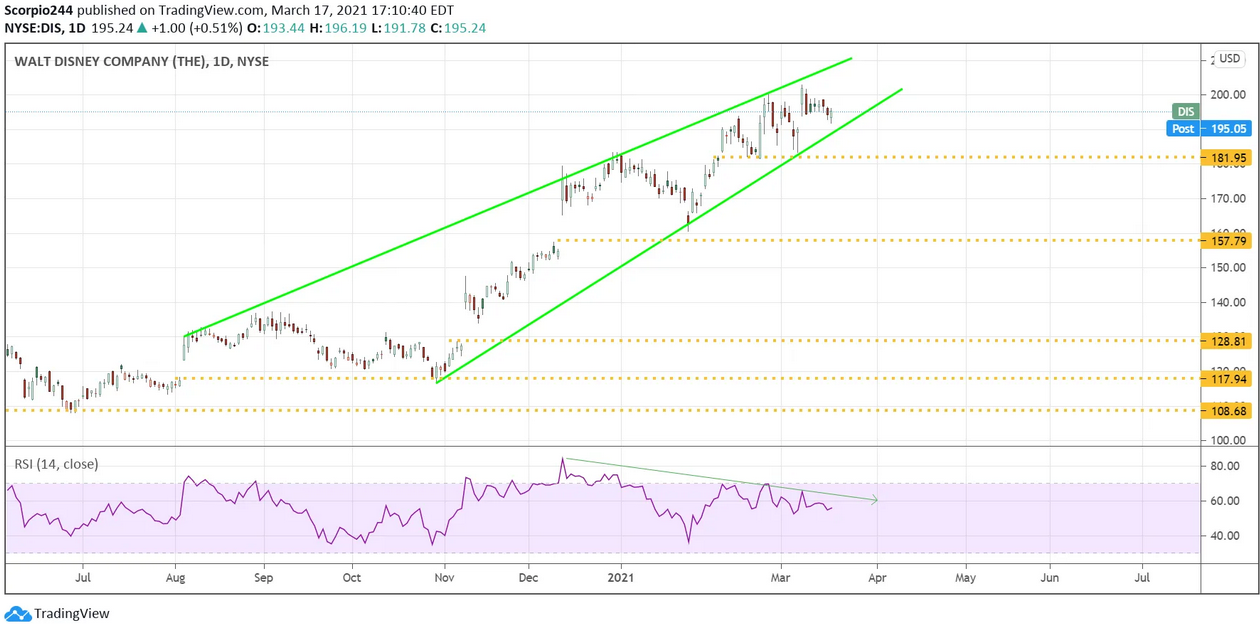
Disney (NYSE:DIS) continues to play inside of this rising wedge pattern. It might have even a little bit higher to climb, perhaps to $205-207. But the pattern is notably bearish, and the RSI is telling us the trend to follow is likely down.
Altria
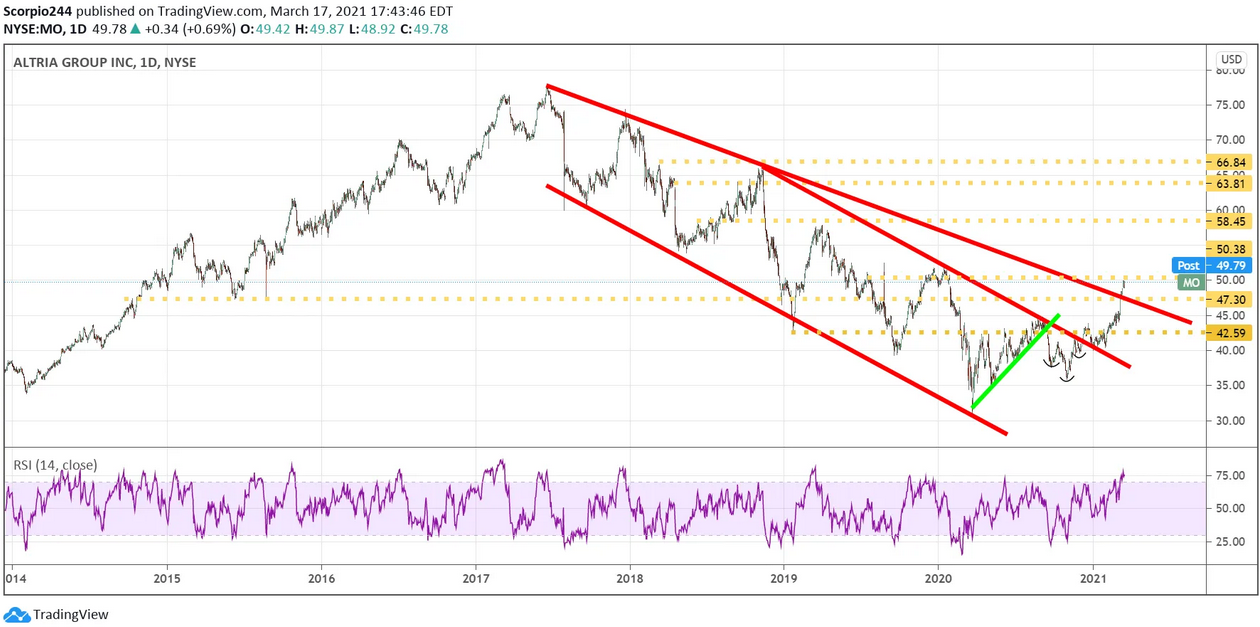
Altria (NYSE:MO) is one stock that may continue to head higher, the stock is breaking a multi-year downtrend, and if it passes resistance at $50, it has room to run to $58.
