Upcoming US Events for Today:
- Weekly Jobless Claims will be released at 8:30am. The market expects Initial Claims to show 300K versus 302K previous.
- Treasury Budget for August will be released at 2:00pm.
Upcoming International Events for Today:
- German CPI for August will be released at 2:00am EST. The market expects a year-over-year increase of 0.8%, consistent with the previous report.
The Markets
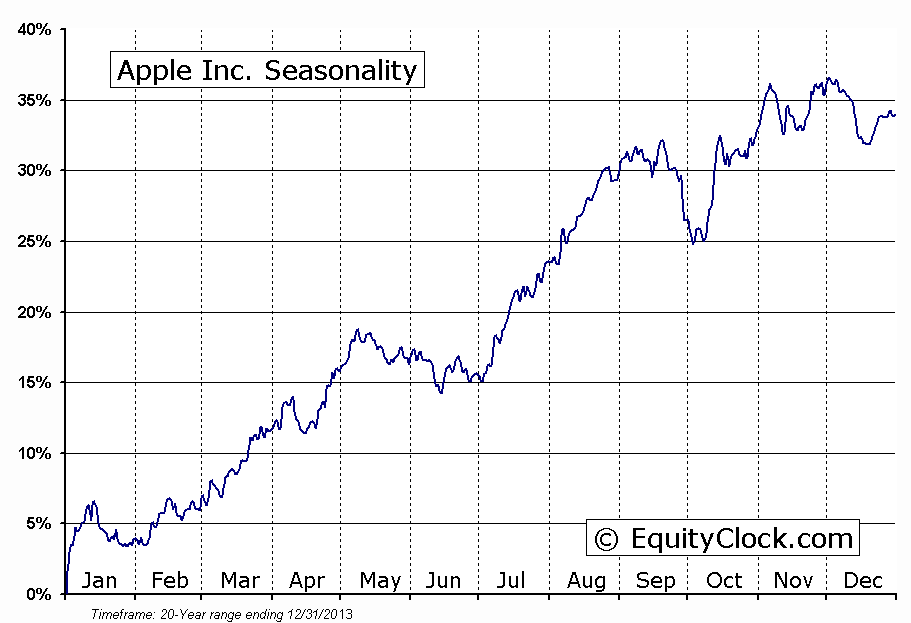
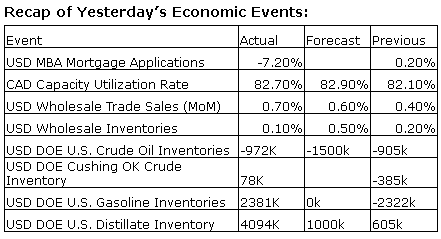
Stocks edged higher on Wednesday, led by shares of Apple (NASDAQ:AAPL) as the stock rebounded from yesterday’s wild ride that followed the unveiling of its next set of iPhones. Shares of AAPL ended higher by just over three percent, bouncing from a rising 50-day moving average and alleviating the short-term oversold condition from the selloff that began at the start of September. Seasonally, September is the weakest month of the year for this tech titan, averaging a loss of 3% over the course of the month. Despite the negative seasonal tendencies in front of us, the technical profile of the stock continues to look positive, as suggested by rising significant moving averages. Any weakness in and around the release of the recently announced iPhones may provide ideal buying opportunities for the period of seasonal strength for the technology sector, which spans the fourth quarter. The stock has averaged a gain of 6.1% during the month of October with positive results realized in 14 of the past 20 periods.

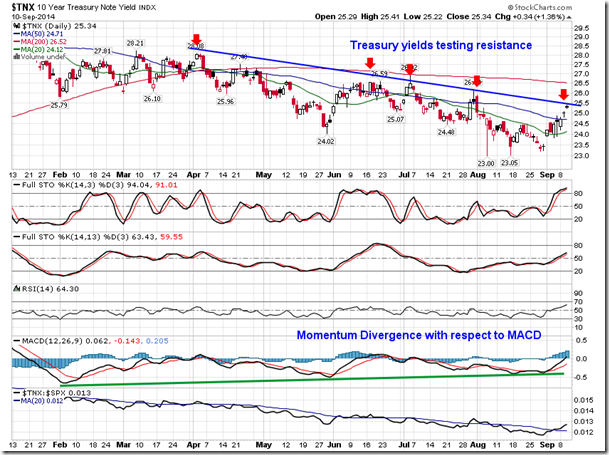
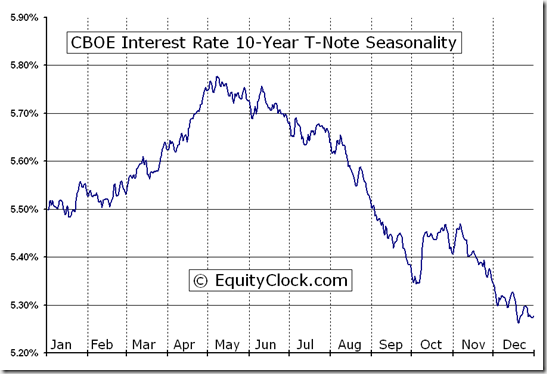
Meanwhile, away from the equity market, treasury yields are once again testing intermediate resistance. The yield on the 10-year note is bumping up against a declining trendline that stretches back to April of this year as a trend of lower-highs and lower-lows remains apparent. Despite ongoing calls for higher yields, the bond market continues to defy the popular belief; prices have gained (yields have fallen) since the Spring during what is typically the seasonally strong period for the asset class. The period of seasonal strength concludes in October, on average. Should yields break above resistance, currently at 2.55%, a technical sell signal for the seasonal trade would be triggered. A positive momentum divergence with respect to MACD suggests a point of caution, perhaps indicating that the trade may be coming to an end sooner than later. It remains significant that the treasury market can continue to chart gains given the overwhelming strength in the equity market; fixed income investors remain unwilling to participate in stocks, preventing the equity market from achieving greater strength than what has already been realized. The next correction in equity markets, whenever that may be, may be the catalyst for bond investors to find appealing levels in stocks that warrant the additional risk that equities present. As noted in yesterday’s report, volume for the S&P 500 Index is less than half of what is was during the last major market correction in 2011 and it may take the bond market to get the activity in equity markets back to longer-term historical averages.
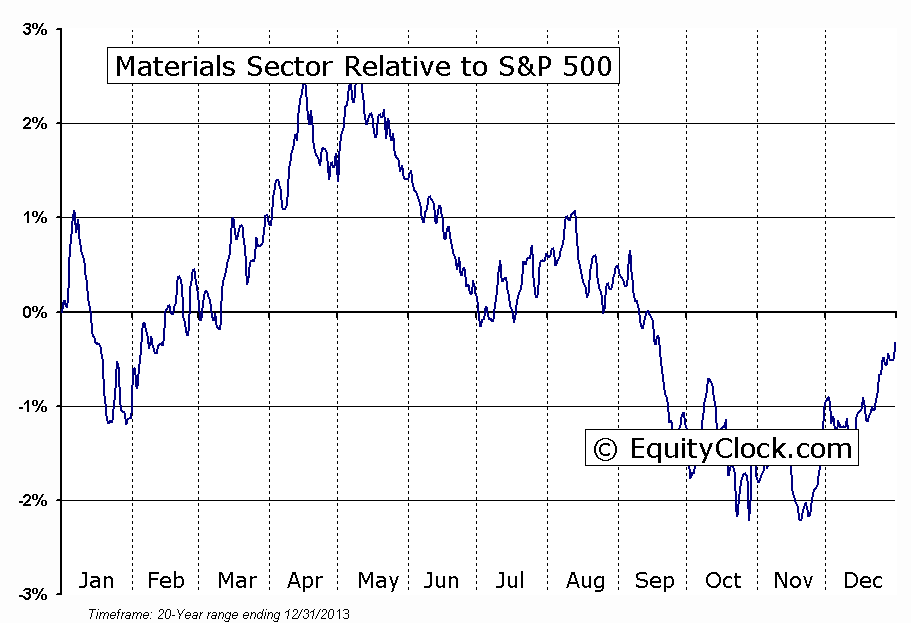
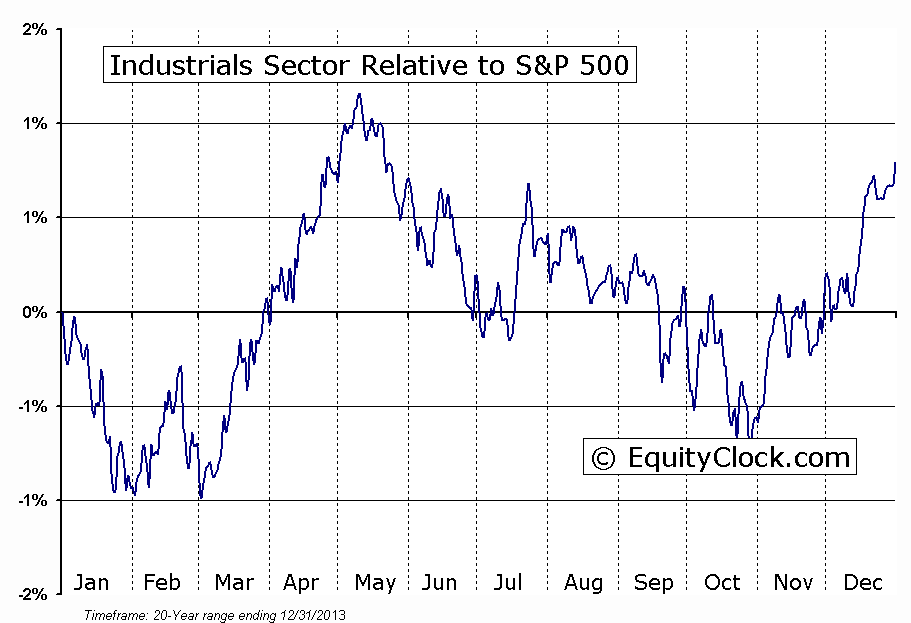
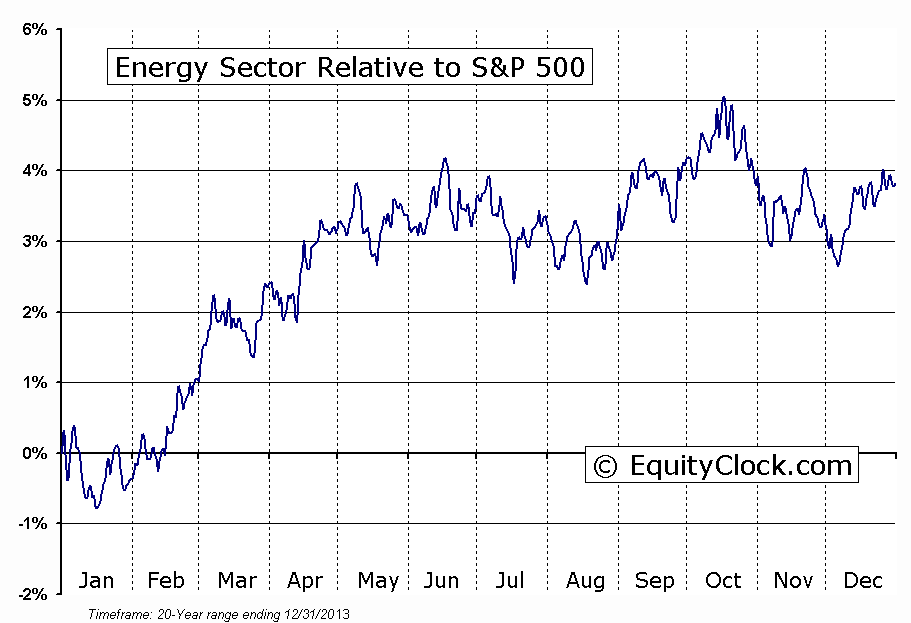
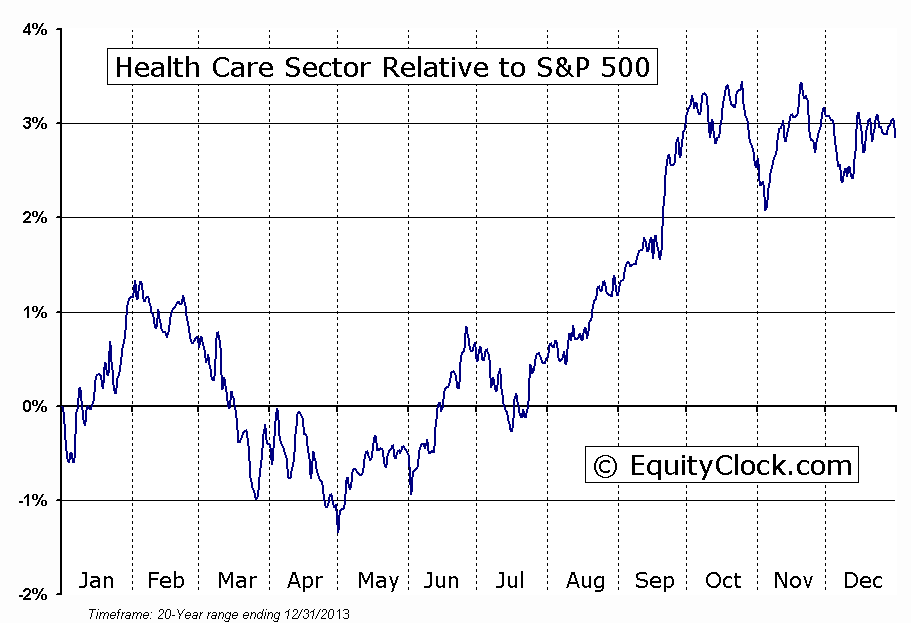
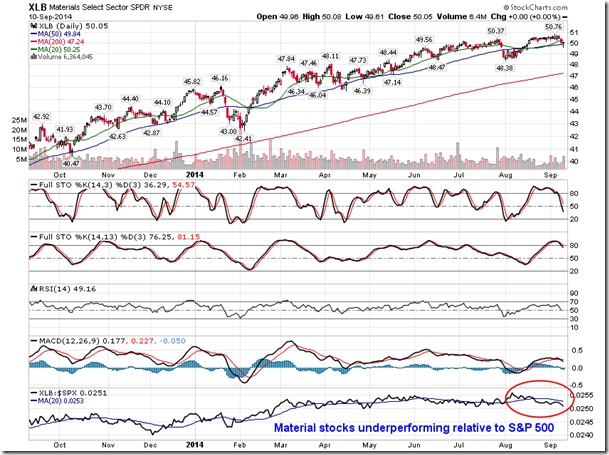
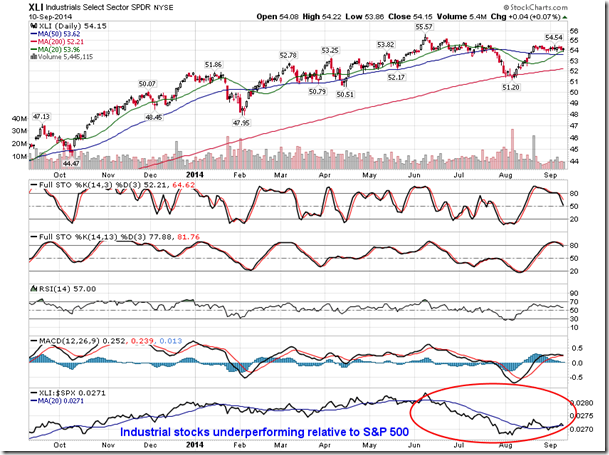
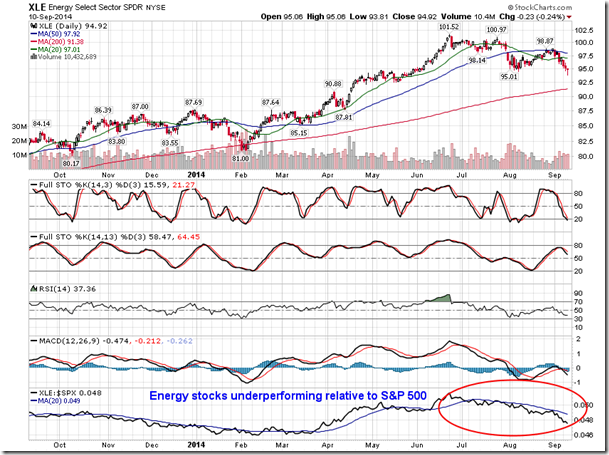
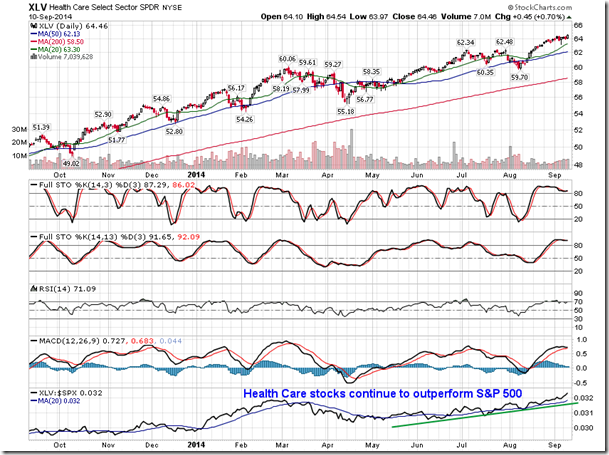
Looking at the relative performance of the equity market sectors, the three major economically sensitive sectors (Industrials, Materials, and Energy) are showing signs of lag compared to the broad market. Energy and Material stocks have gotten particularly hurt in the last few days as a higher dollar puts a strain on these commodity dependent sectors. Underperformance in these three areas of the market can often be perceived as a warning signal for economic activity, typically resulting in negative impacts to the broad market, overall. Material and Industrial stocks remain seasonally weak into October. Meanwhile, the more defensive Health Care sector continues to outperform all other sectors, charting a new all-time closing high during Wednesday’s session. The Health Care sector remains strong through to the start of October, marking the conclusion to a stellar seasonal run that began in April. Should the trend amongst equity sectors continue to gravitate towards risk aversion (out of cyclicals and into defensives), broad market declines would likely follow.
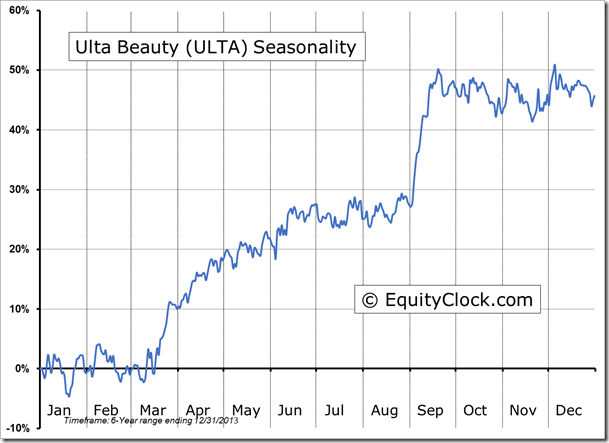
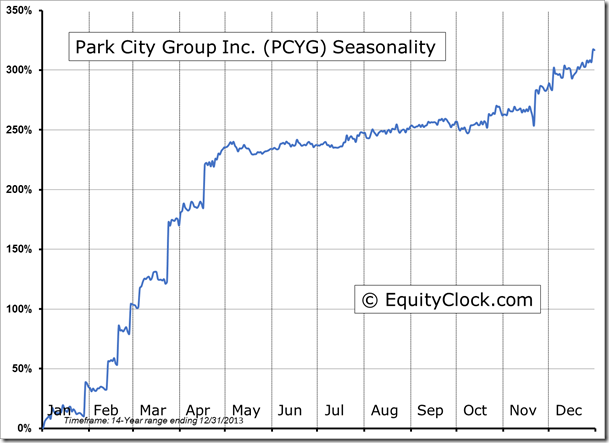
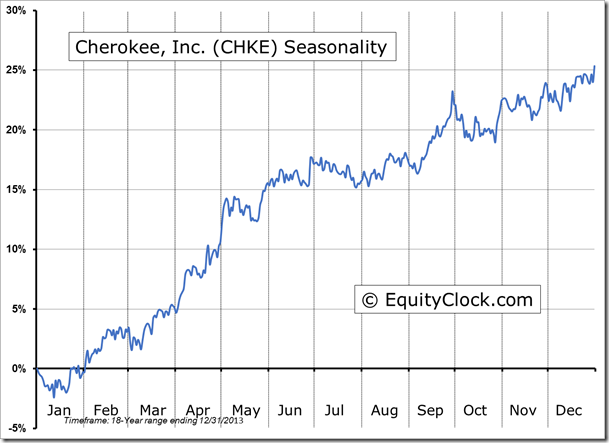
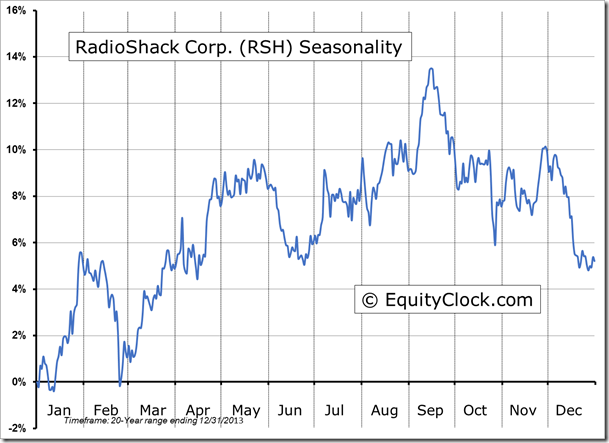
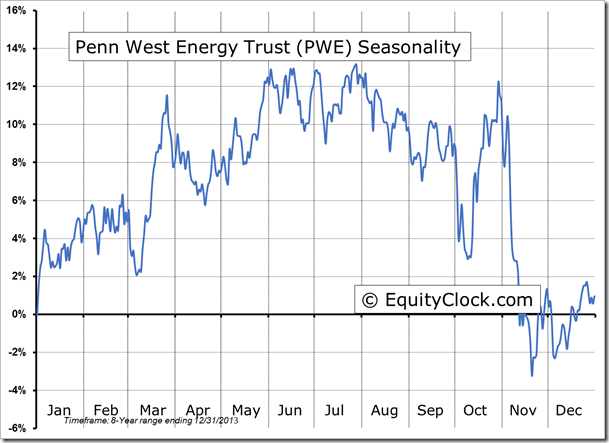
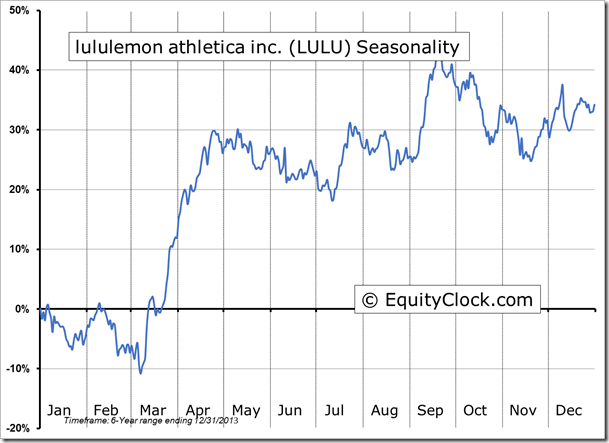
Seasonal charts of companies reporting earnings today:
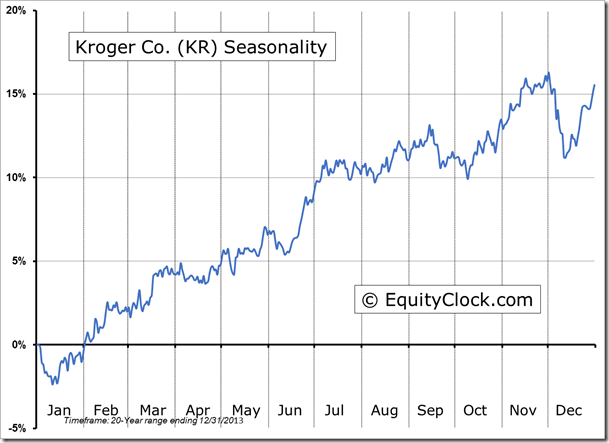
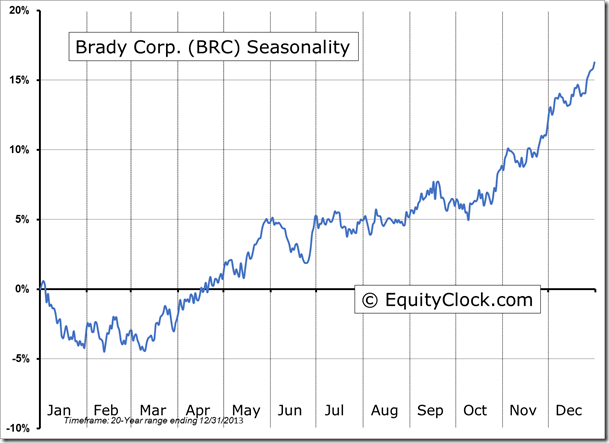
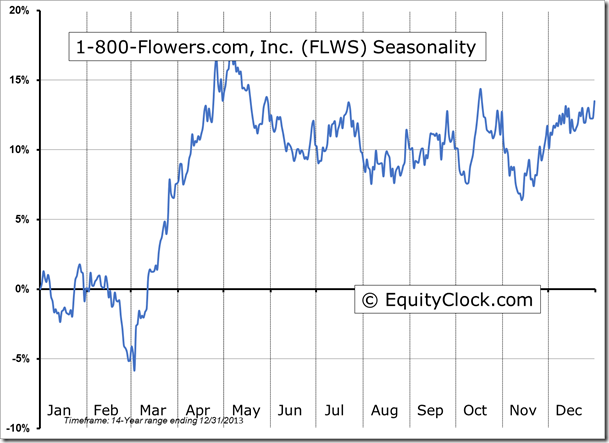
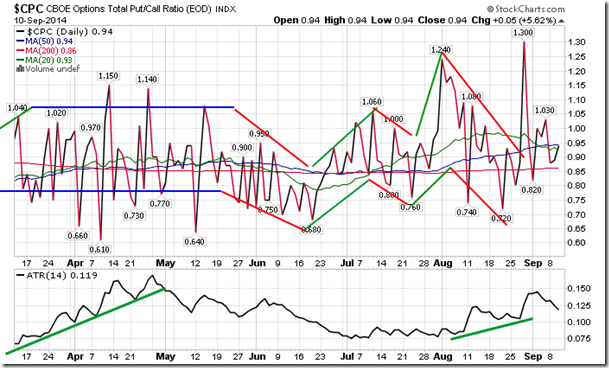
Sentiment on Wednesday, as gauged by the put-call ratio, ended bullish at 0.94.
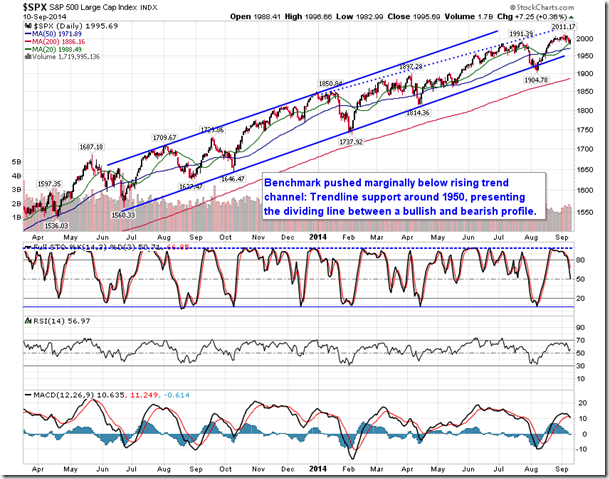
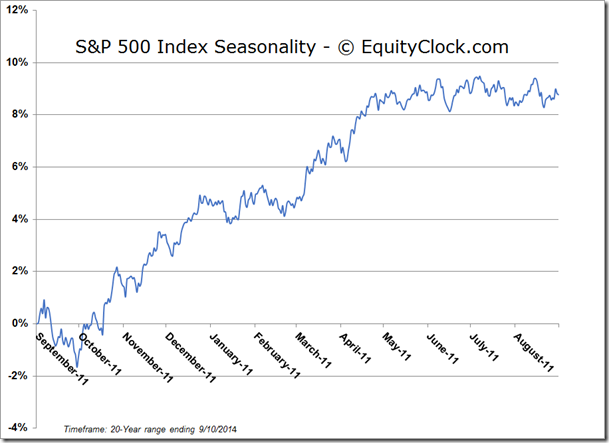
S&P 500 Index
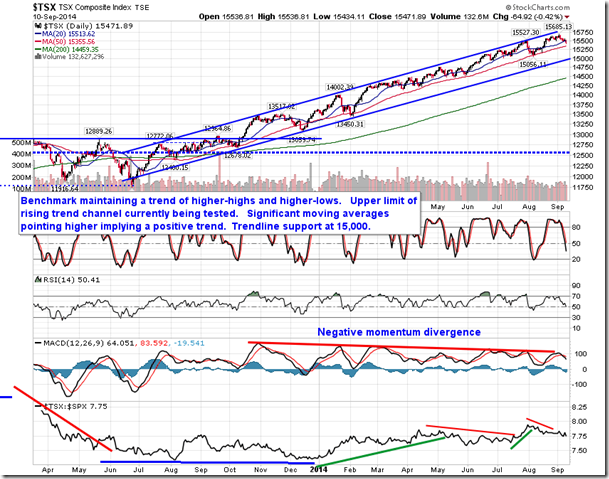
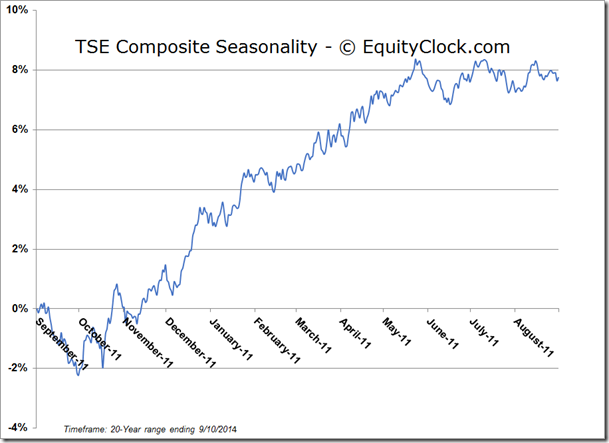
TSE Composite
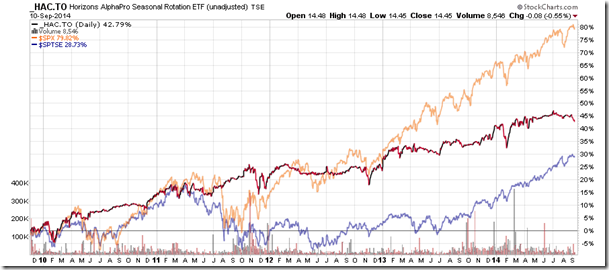
Horizons Seasonal Rotation ETF (TSX:HAC)
- Closing Market Value: $14.45 (down 0.55%)
- Closing NAV/Unit: $14.46 (up 0.05%)
Performance*
| 2014 Year-to-Date | Since Inception (Nov 19, 2009) | |
| HAC.TO | 1.12% | 44.6% |
* performance calculated on Closing NAV/Unit as provided by custodian
