Stock Rip, Then Dip, In Yesterday's Rapid Afternoon Reversal

Published 07/14/2020, 04:12 AM
Updated 11/16/2024, 07:53 AM
NDX
-
US500
-
SPY
-
QQQ
-
AMZN
-
NVDA
-
VX
-
US10YT=X
-
VIX
-
SQ
-

Stocks reversed lower yesterday in a somewhat violent move, and if you were hoping for a breakout, you got it, and then it failed miserably.

The Nasdaq 100 had been up by as much as 2% but managed to finish lower by about 2%, a nasty 4% intraday swing. Also, we finished at the lows of the days as well. Usually, that is not positive. Neither is the VIX being up all day, despite a big market rally. The sell-off came around the time it was announced California was shutting down indoor activities.

Now earnings season starts today. It may get interesting here.

NASDAQ

So what happens next? I tend to think the Nasdaq is still overbought by a lot and that it needs to fall to the other side of the trading range. What happens after, we will find out when we get there. There is still a considerable distance the QQQ could fall from here. The first level I would look for is at $251, and then after that somewhere around $247. It would be about 5% from the closing price Monday.
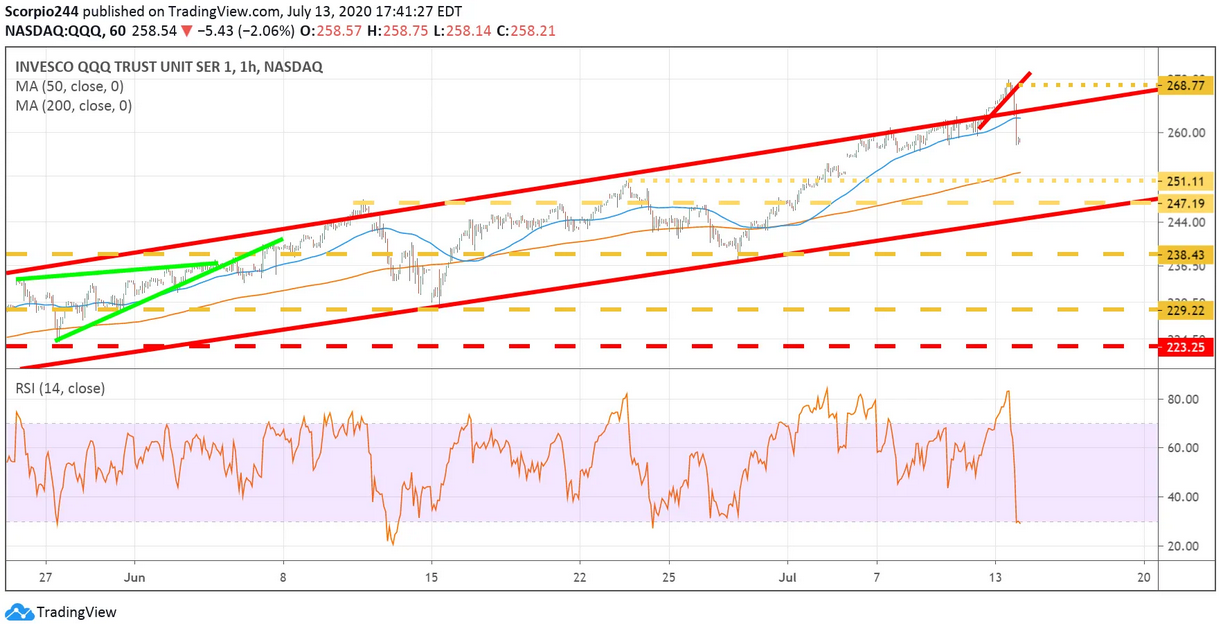
QQQ Chart

S&P 500

Meanwhile, I would think the next meaningful level for the S&P 500would come around 3,115. The index pretty much failed at resistance around 3,230, which also happened to be the prior high in June. Now we have to worry about the potential for a double top pattern, but we have some time to worry.
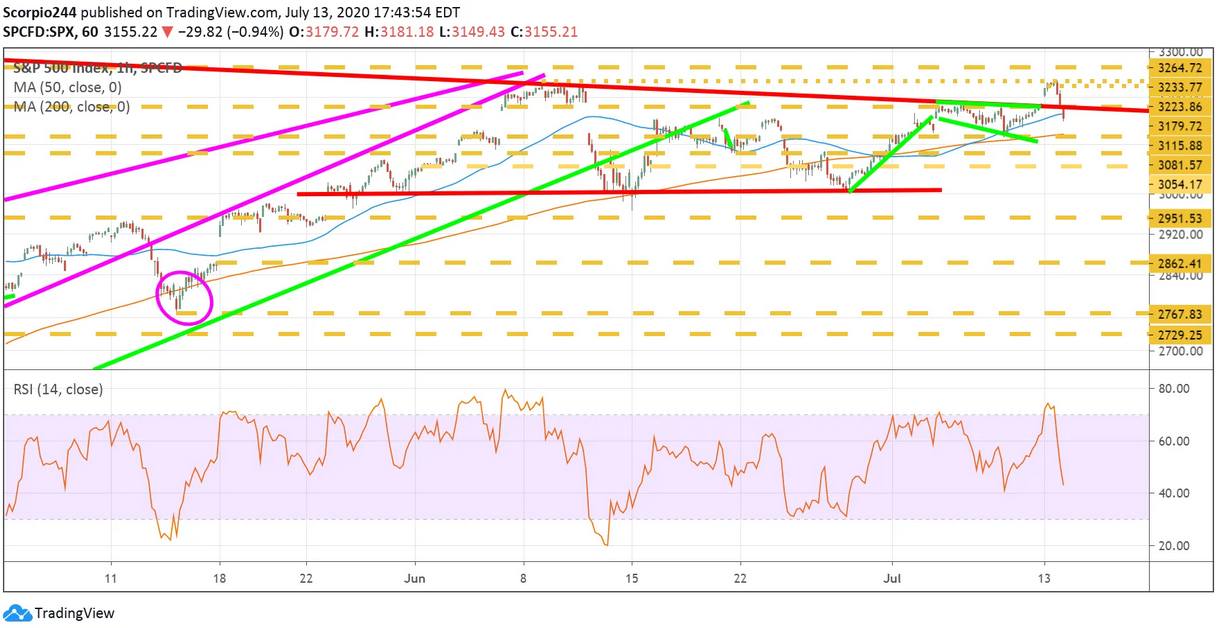
S&P 500 Index 1 Hour Chart

VIX

Meanwhile, the VIX jumped by 18% to move back above 30.
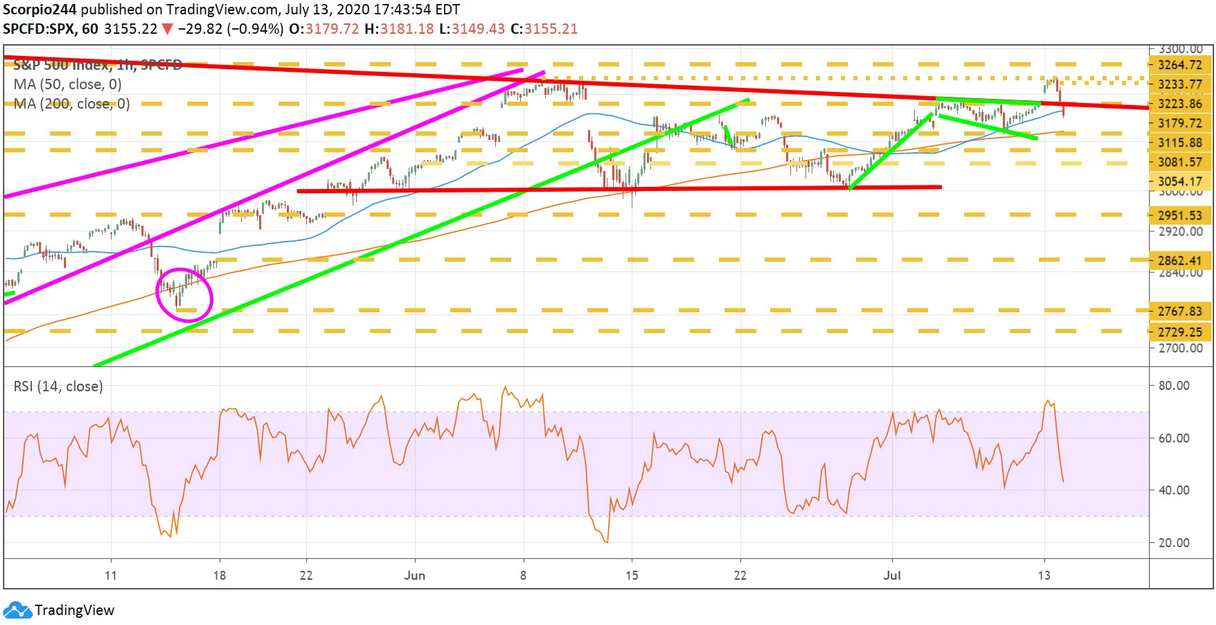
SPX 1 Hr Chart

10-Year

The 10-year is once again moving lower and is at a critical spot. If the 10-year keeps drifting, we could see it back 55 basis points, and that is not good for equities.
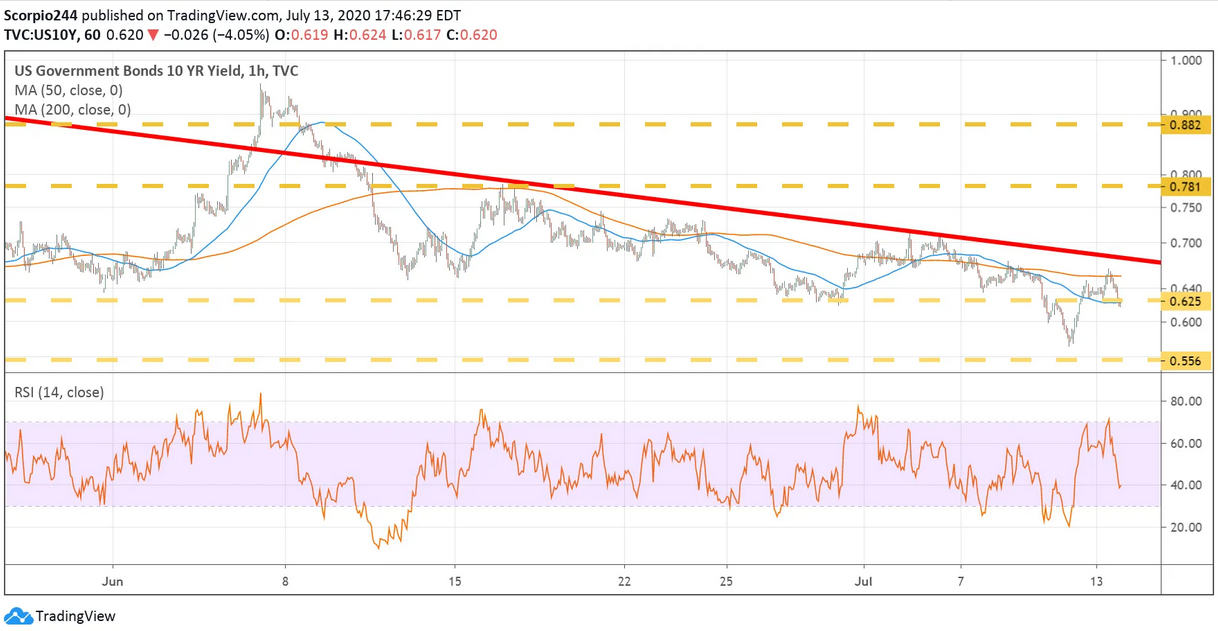
US 10 Yr Bond Yield

Amazon

Amazon (NASDAQ:AMZN) broke its little uptrend, and that could suggest the share dip back to $2,900, potentially even $2,700.
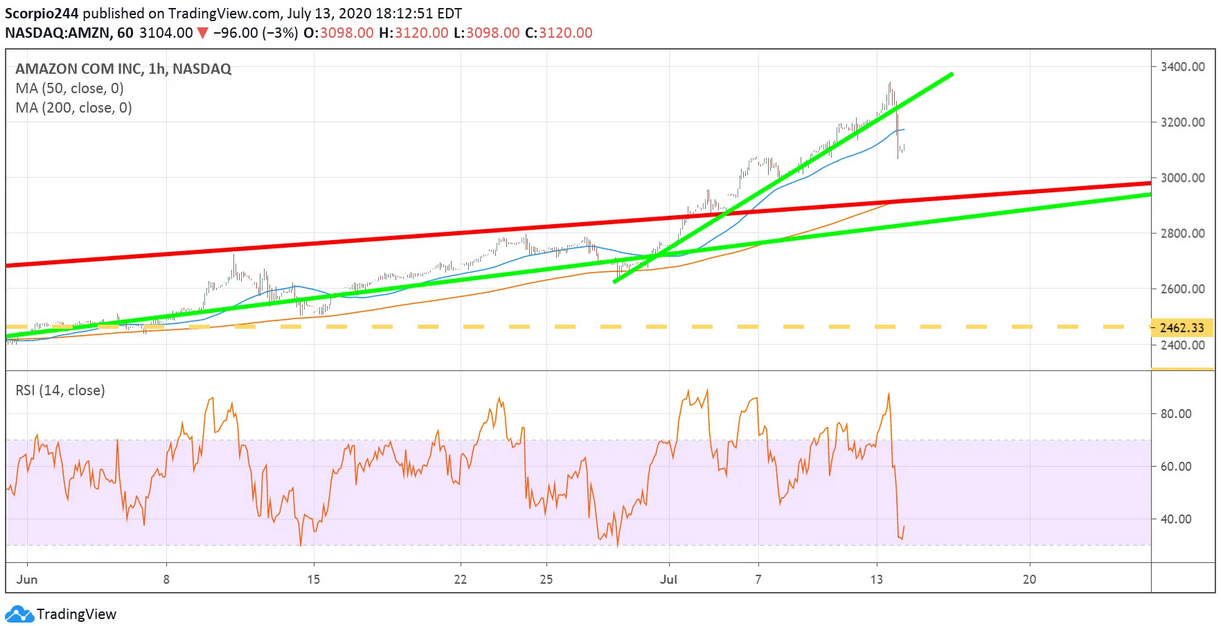
Amazon Inc 1 Hr Chart

Square

Square (NYSE:SQ) fell sharply yesterday, and the stock can’t afford to drop below $118; if it does, it likely means it retraces back to $103.
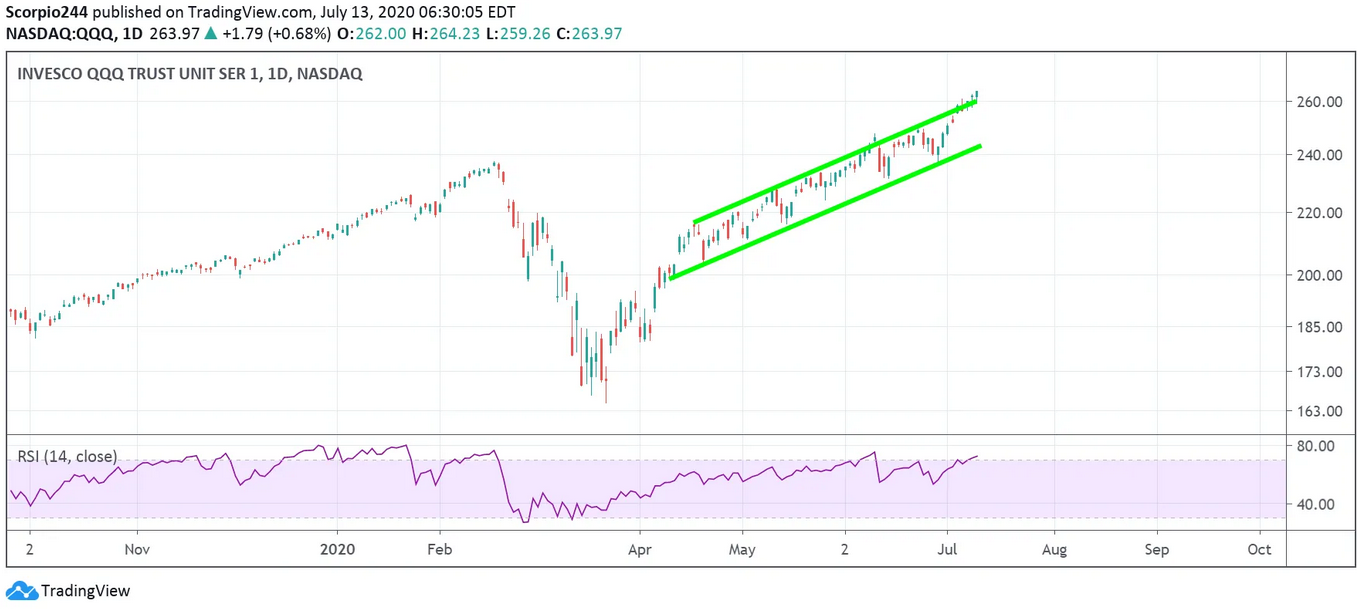
QQQ Daily Chart

NVIDIA

NVIDIA (NASDAQ:NVDA) finished the day in a precarious spot; it most certainly doesn’t want to go below $400. If so, the next stop is at $380, and completion of the rising wedge pattern.
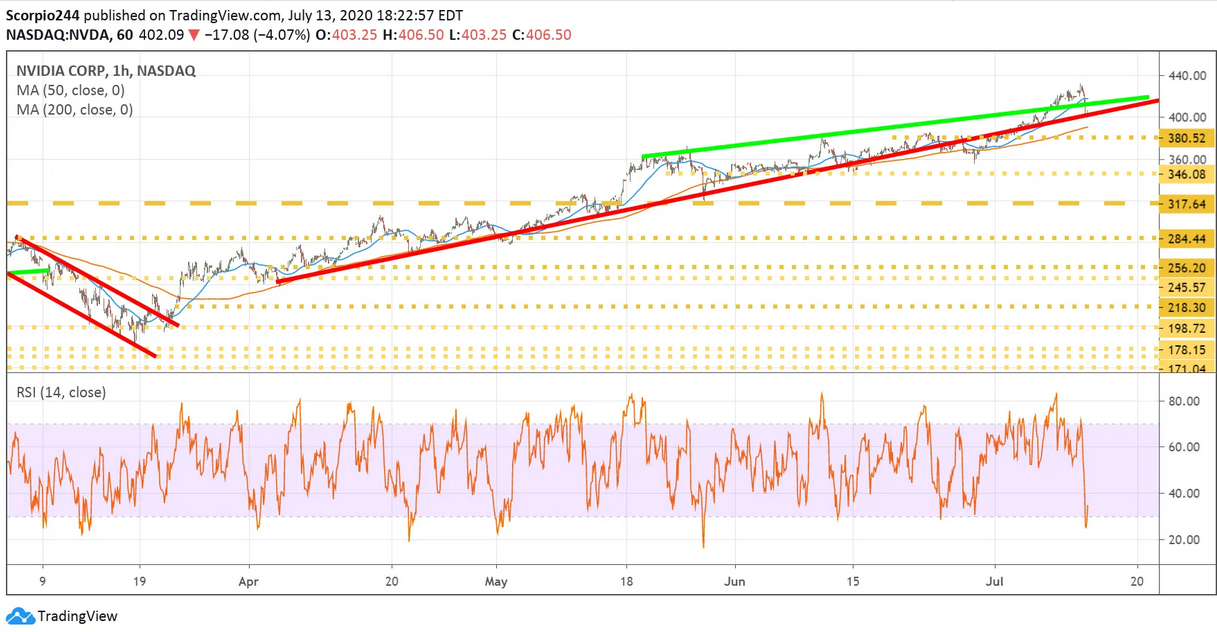
NVIDIA Chart

Original Post

Latest comments

Loading next article…
Risk Disclosure: Trading in financial instruments and/or cryptocurrencies involves high risks including the risk of losing some, or all, of your investment amount, and may not be suitable for all investors. Prices of cryptocurrencies are extremely volatile and may be affected by external factors such as financial, regulatory or political events. Trading on margin increases the financial risks.
Before deciding to trade in financial instrument or cryptocurrencies you should be fully informed of the risks and costs associated with trading the financial markets, carefully consider your investment objectives, level of experience, and risk appetite, and seek professional advice where needed.
Fusion Media would like to remind you that the data contained in this website is not necessarily real-time nor accurate. The data and prices on the website are not necessarily provided by any market or exchange, but may be provided by market makers, and so prices may not be accurate and may differ from the actual price at any given market, meaning prices are indicative and not appropriate for trading purposes. Fusion Media and any provider of the data contained in this website will not accept liability for any loss or damage as a result of your trading, or your reliance on the information contained within this website.
It is prohibited to use, store, reproduce, display, modify, transmit or distribute the data contained in this website without the explicit prior written permission of Fusion Media and/or the data provider. All intellectual property rights are reserved by the providers and/or the exchange providing the data contained in this website.
Fusion Media may be compensated by the advertisers that appear on the website, based on your interaction with the advertisements or advertisers.
© 2007-2025 - Fusion Media Limited. All Rights Reserved.