AT40 = 71.3% of stocks are trading above their respective 40-day moving averages (DMAs) – overbought day #2
AT200 = 58.6% of stocks are trading above their respective 200DMAs
VIX = 9.5
Short-term Trading Call: bullish
Commentary
It looks like an overbought rally is truly underway.
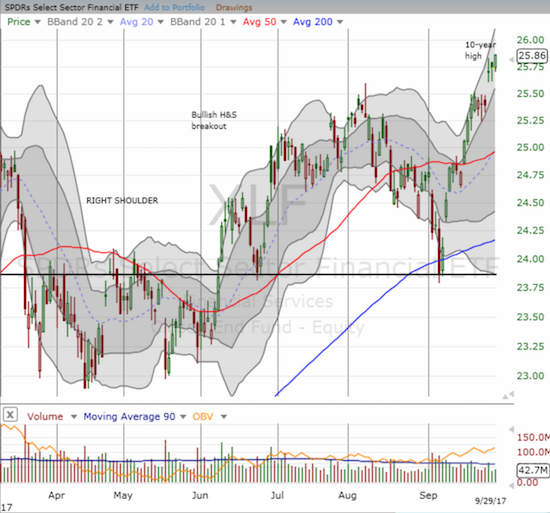
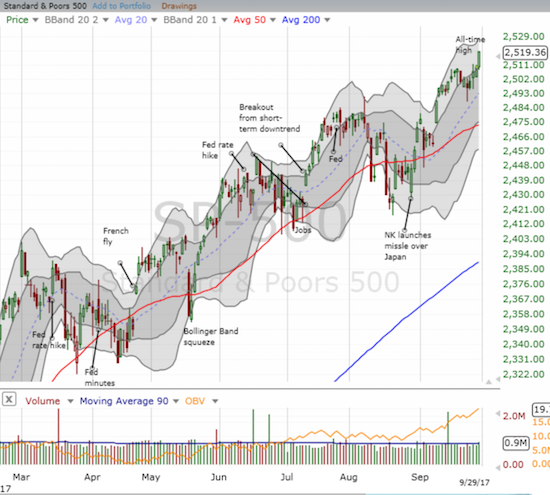
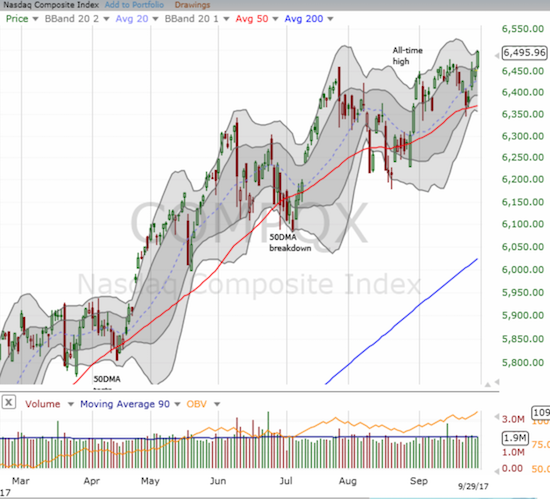
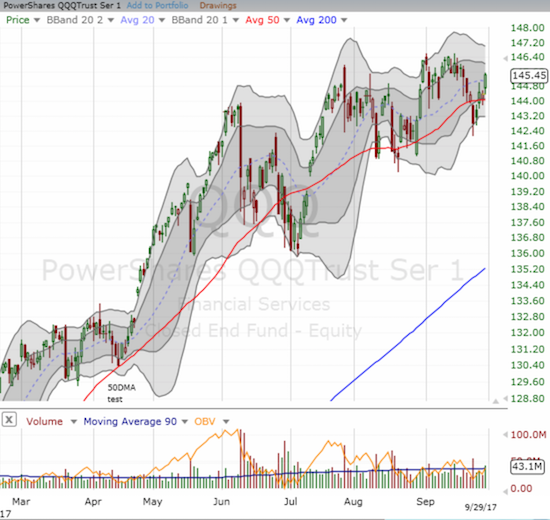
AT40 (T2108), the percentage of stocks closing above their 40-day moving averages (DMAs), closed at 71.3%, the second day of the overbought period. The iShares Russell 2000 (NYSE:IWM) gained for the 6th day in a row and the 23rd day of the last 28 since retesting its 2017 low. The Financial Select Sector SPDR ETF (NYSE:XLF) closed at a fresh 10-year high by notching its 11th daily gain out of the last 16 days after retesting support formed from the 2017 breakout point in February. The S&P 500 (SPY (NYSE:SPY)) hit a convincing all-time high. The NASDAQ hit a new all-time high. The PowerShares QQQ ETF (NASDAQ:QQQ) gained 0.7% but stopped well short of a new all-time high.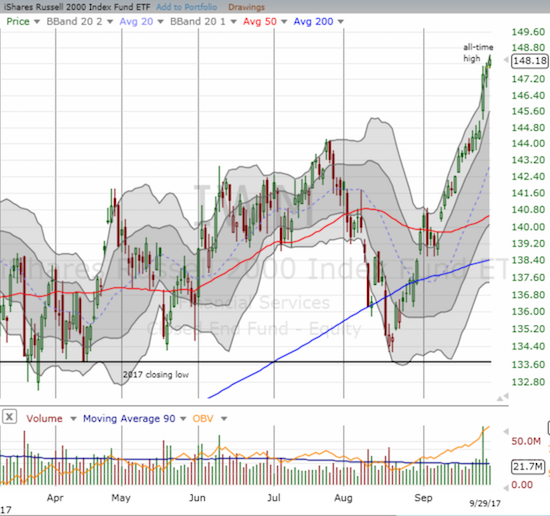
The iShares Russell 2000 ETF kept its streak alive as it soars through the upper-Bollinger® Band (BB) channel.
The Financial Select Sector SPDR ETF finally confirmed the bullish invalidation of 2017’s head and shoulders pattern.
Buyers rushed into the S&P 500 and printed a fresh all-time high.
Buyers sent the NASDAQ into a new all-time high.
The PowerShares QQQ ETF has recovered from a 50DMA breakdown.
Per the plan I laid out in my last Above the 40 post, I am looking to load up on QQQ call options. I started on Friday when a lowball offer triggered, but I decided to take profits after the stock market rallied nicely into the close. I have also added XLF to my buy list.
The volatility index, the VIX, closed at a new low for this cycle. The VIX continues a creep toward history – a 24-year low and perhaps a new all-time low – which confirms the bullish sentiment.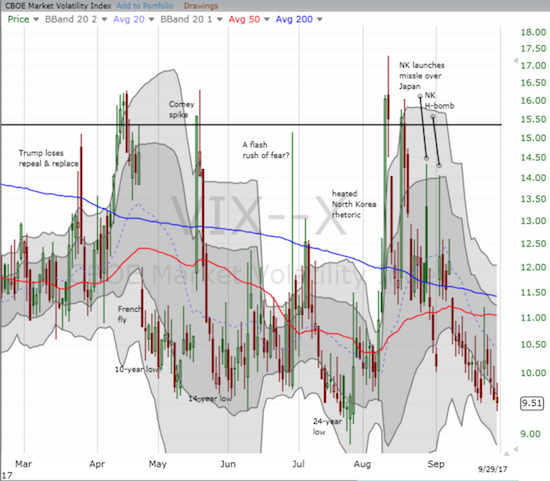
The volatility index, the VIX, keeps creeping up on fresh history.
On the currency side, the Australian dollar is NOT confirming market bullishness. The currency hit a patch of weakness over the last week and a half. My favorite indicator, AUD/JPY, the Aussie against the Japanese yen, has dipped without breaking support. So while AUD/JPY is not flagging any bearishness, its failure to confirm bullishness is a mild warning to watch. I referenced the currency in an earlier post on iron ore.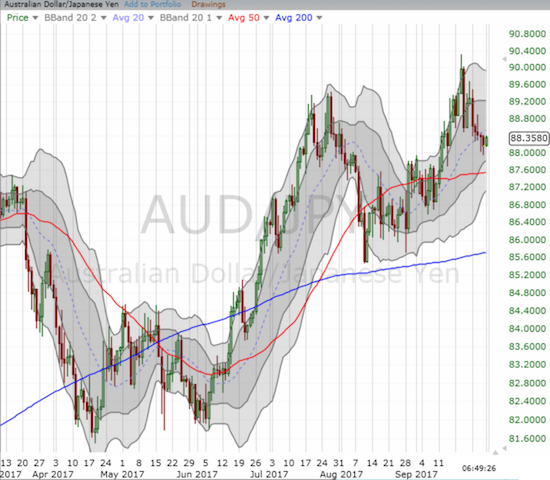
The rally in AUD/JPY is now lagging the stock market.
October is the last of the three seasonally weak months, but there are no signs to indicate the month will deliver. Even if a sell-off finally erupts, the angst will most likely provide a very valuable dip to buy to play a rally as the seasonally strong period launches in November.
STOCK CHART REVIEWS
Apple (NASDAQ:AAPL)
I do not (yet) have a play for call options this week for AAPL. Somehow the intraday dip on Friday did not trigger my lowball offer. I will be looking for a new entry on Monday and/or Tuesday.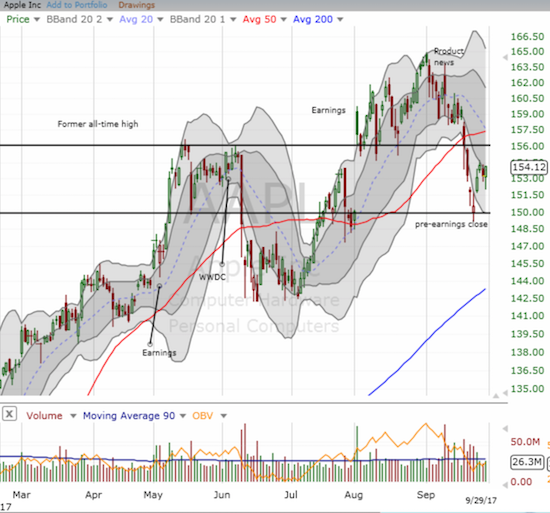
Apple (AAPL) stalled the past two days after a sharp bounce from support.
Intercept Pharmaceutical (NASDAQ:ICPT)
I finally covered my short on ICPT as my hedging call option expired on Friday. The timing seemed right as it looked like ICPT was about to confirm a bottoming process. Instead, the stock faded from its high of the day two days in a row. I will likely go back to shorting if ICPT breaks below the recent low. I am undecided on how to play the stock, if at all, if a rally does ensue.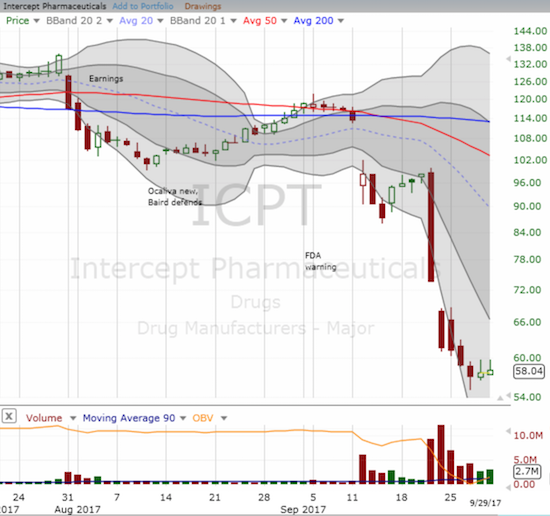
Intercept Pharmaceutical faded from its highs the past two days. It is on the edge of starting a bottoming attempt.
iShares US Home Construction ETF (NYSE:ITB)
It looks like I will not get an opportunity to buy back into home builders at discount pricing! ITB tacked on another 1.0% on its way to a fresh 10-year high. ITB alone screams bullishness for the stock market.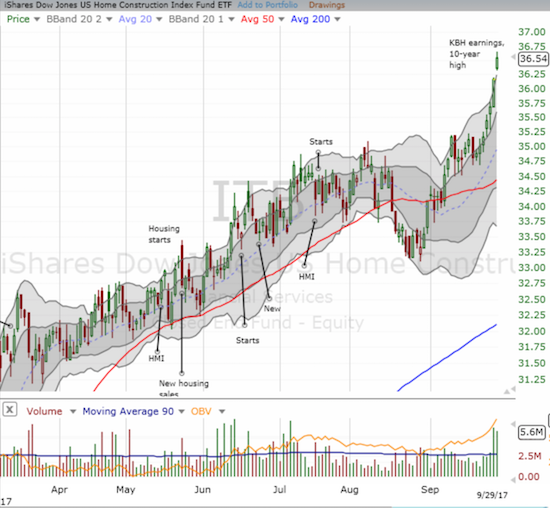
A rare move: the iShares US Home Construction ETF gapped up and closed above its upper-BB.
iPath Bloomberg Coffee SubTR ETN (NYSE:JO)
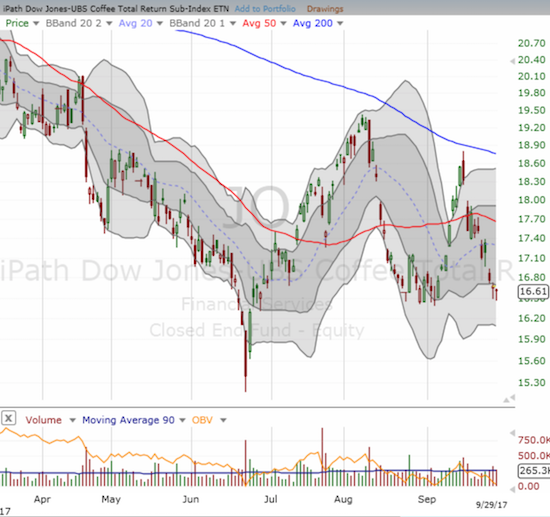
I have stalked JO for a long time, watching its moves from week-to-week. I finally jumped aboard on Friday as JO retested support from its August low. I think the downside risk is limited to the June low. The downtrending 200DMA keeps coming up as tough upside resistance. I like trading coffee because its demand is strong and secular. The bout of weakness in 2017 is bound to transform into a strong rally at some point in the coming year or so – that’s my bet anyway!
The iPath Bloomberg Coffee SubTR ETN has swung wildly with its downward trending 200DMA holding as resistance.
U.S Steel (NYSE:X)
U.S. Steel looked “done” after a downgrade from Cohen punched it below 50DMA support. I dared to double down on my call positions anyway – so far, so good. X has rallied a surprising 5 days in a row. I am now looking for a retest of 200DMA resistance.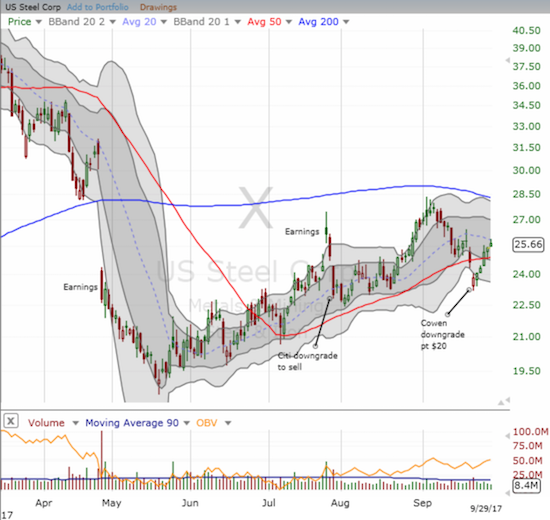
U.S. Steel recovered from a pretty bad 50DMa breakdown.
SPDR S&P Retail ETF (MX:XRT)
Toys R Us filed for bankruptcy on September 19, 2017. According to the Washington Post, the company’s $7.5B in debt could cause a ripple effect in the industry as a small panic ensues. XRT dipped further on the heels of the news, but is now motoring higher. I am watching closely to see whether the ETF can finally break free of 200DMA resistance and confirm the breakout. Such a move would be incredibly bullish given all the negative news weighing heavily on retailers.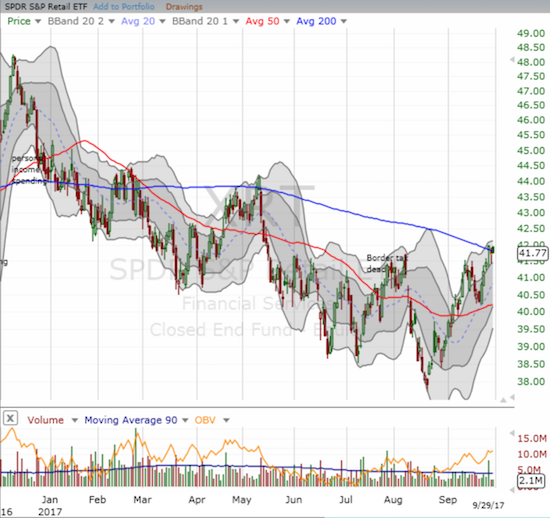
The SPDR S&P Retail ETF is once again wrestling with 200DMA downtrending resistance.
Teva Pharmaceutical Industries Limited (NYSE:TEVA)
My sale of TEVA call options turned out to be well-timed. I am now looking to roll back in as 20DMA support holds. I was wondering whether I would get the next opportunity on a complete gap fill.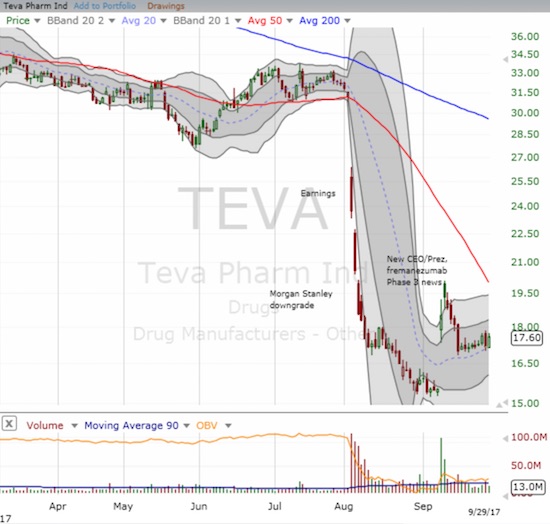
Teva Pharmaceutical Industries Limited (TEVA) is struggling to regain momentum from its lows.
“Above the 40” uses the percentage of stocks trading above their respective 40-day moving averages (DMAs) to assess the technical health of the stock market and to identify extremes in market sentiment that are likely to reverse. Abbreviated as AT40, Above the 40 is an alternative label for “T2108” which was created by Worden. Learn more about T2108 on my T2108 Resource Page. AT200, or T2107, measures the percentage of stocks trading above their respective 200DMAs.
Active AT40 (T2108) periods: Day #402 over 20%, Day #216 over 30%, Day #16 over 40%, Day #15 over 50%, Day #11 over 60%, Day #2 over 70% (overbought)
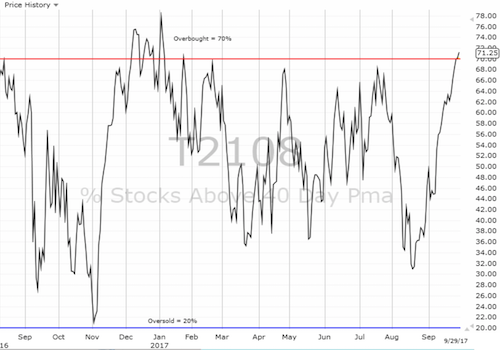
Black line: AT40 (T2108) (% measured on the right)
Red line: Overbought threshold (70%); Blue line: Oversold threshold (20%)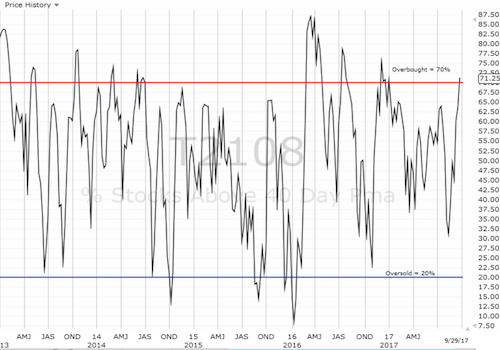
Be careful out there!
Full disclosure: long JO, long X calls
*Charting notes: FreeStockCharts.com uses midnight U.S. Eastern time as the close for currencies. Stock prices are not adjusted for dividends.

