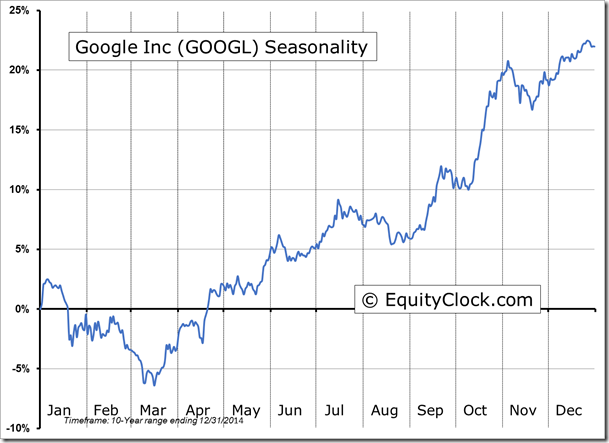
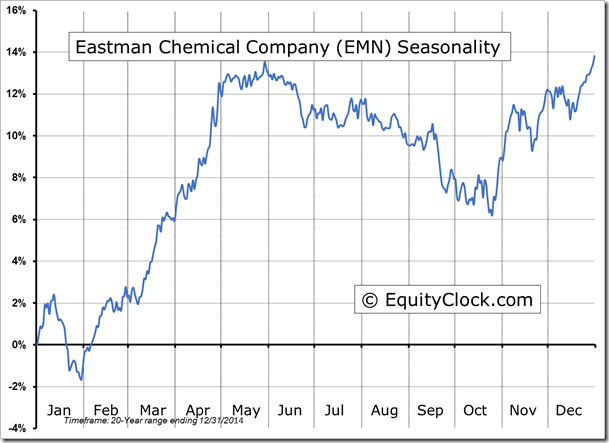
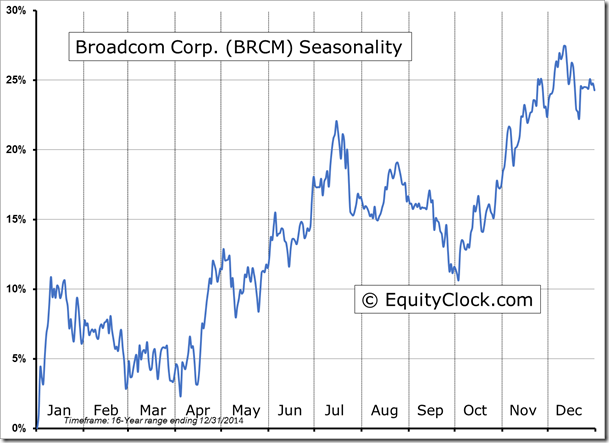
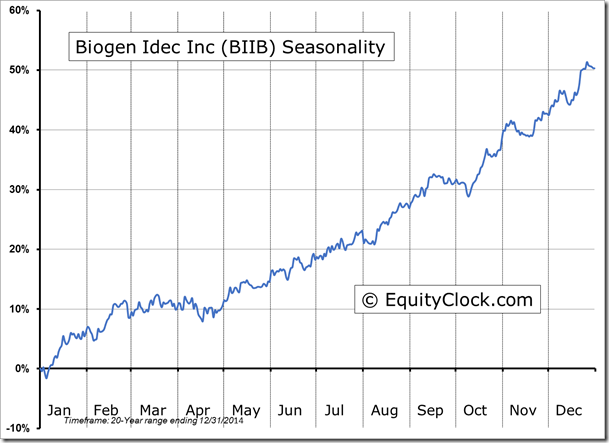
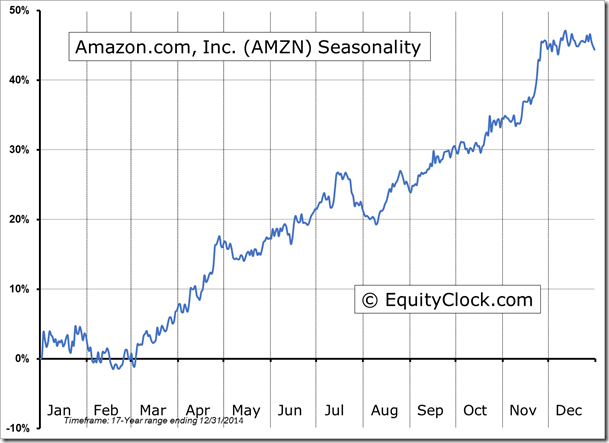
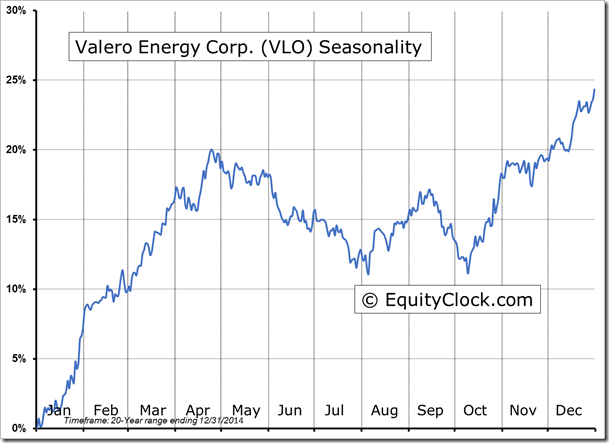
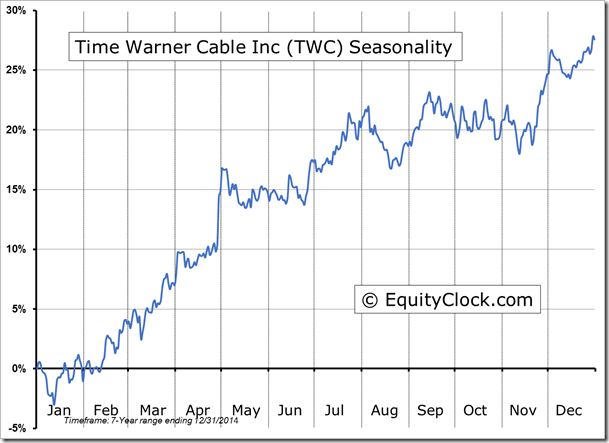
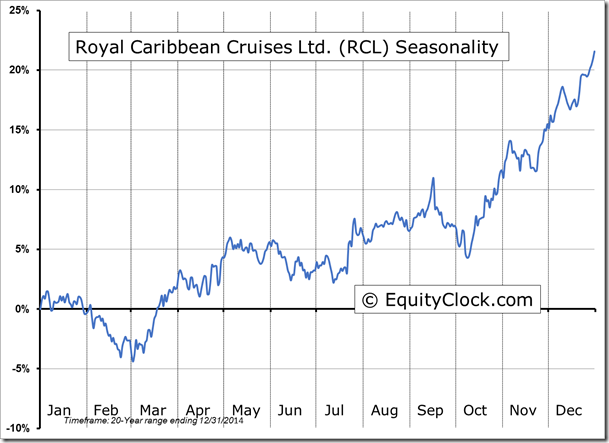
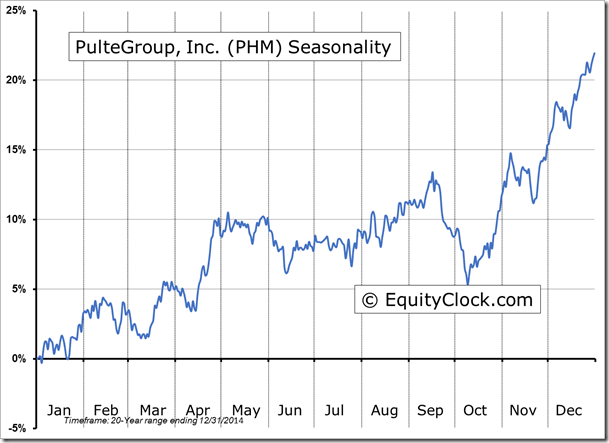
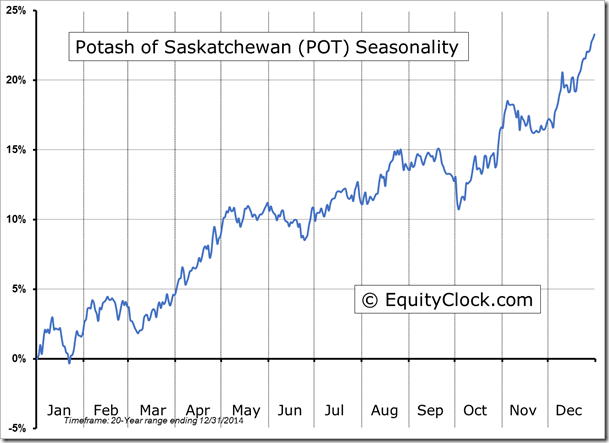
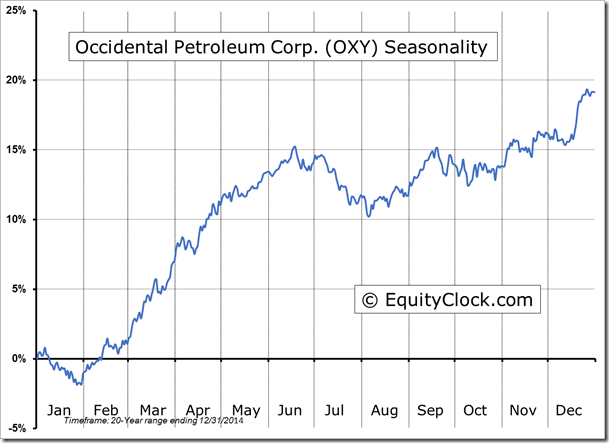
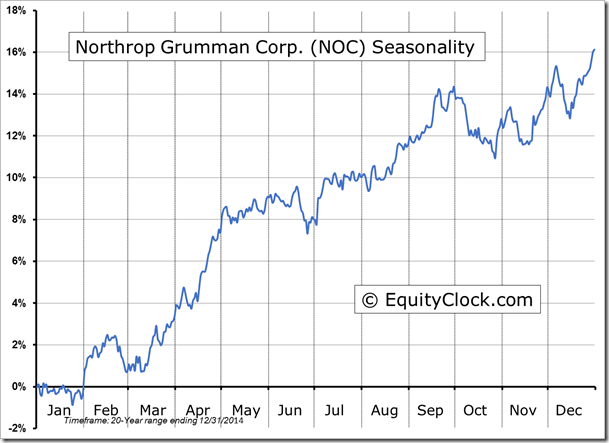
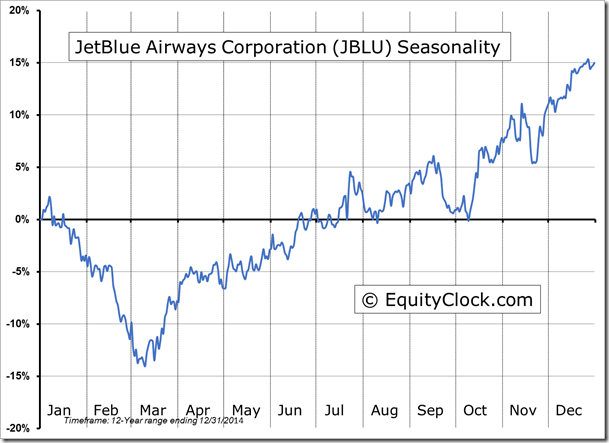
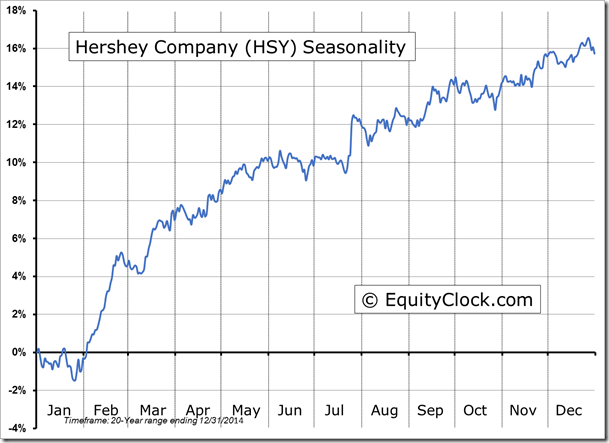
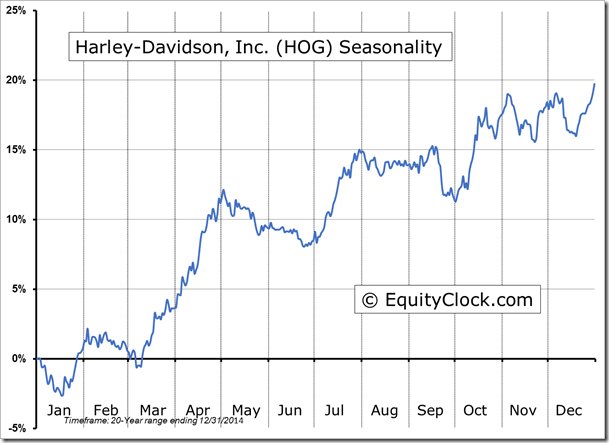
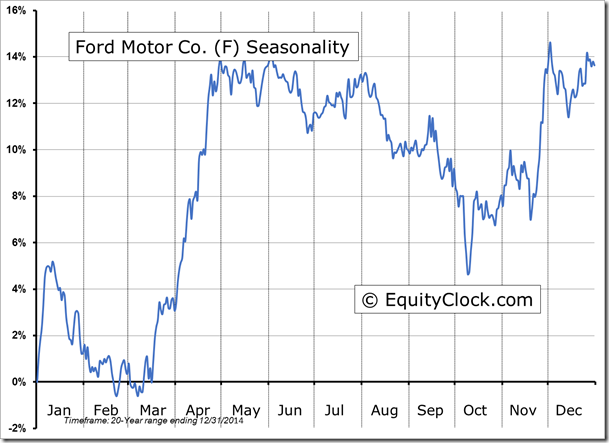
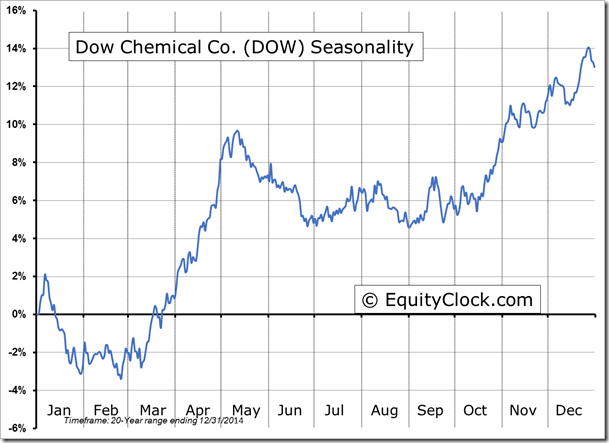
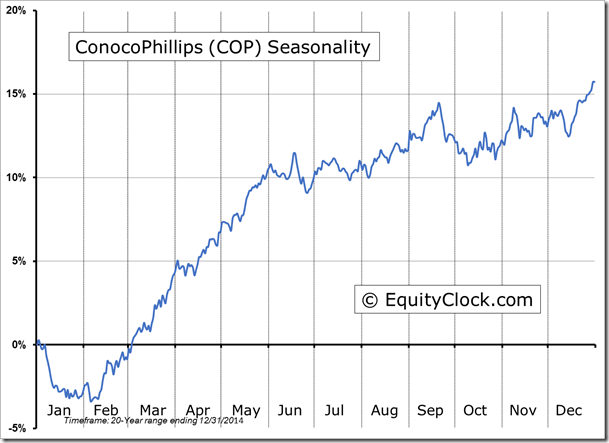
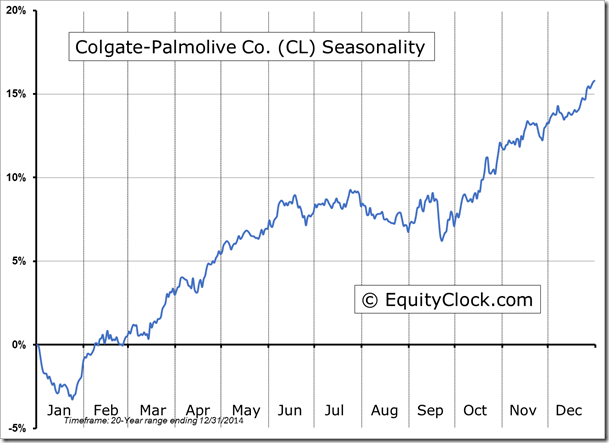
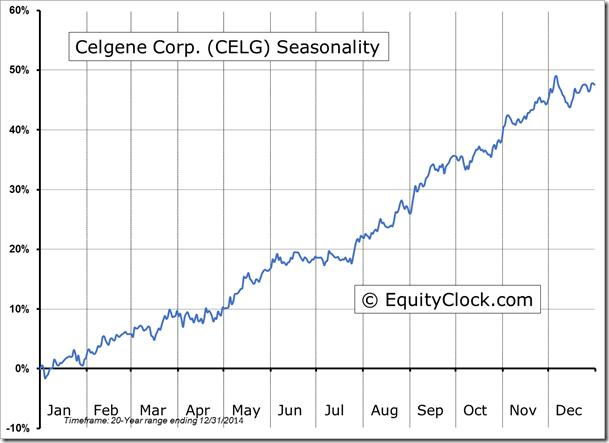
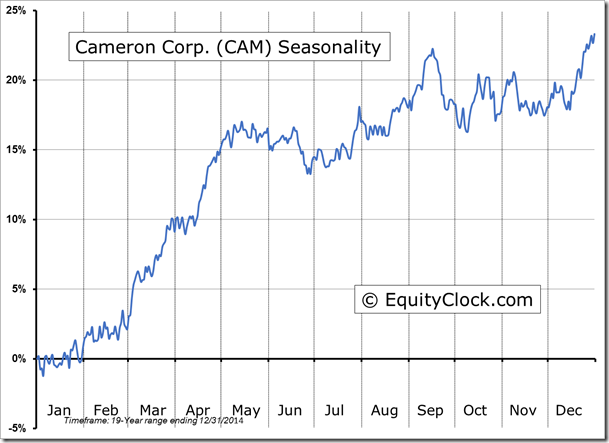
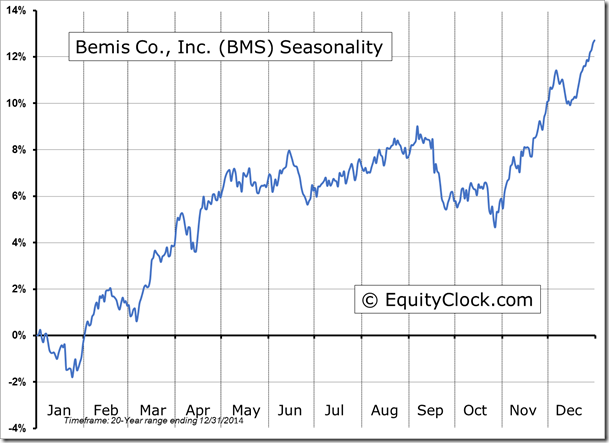
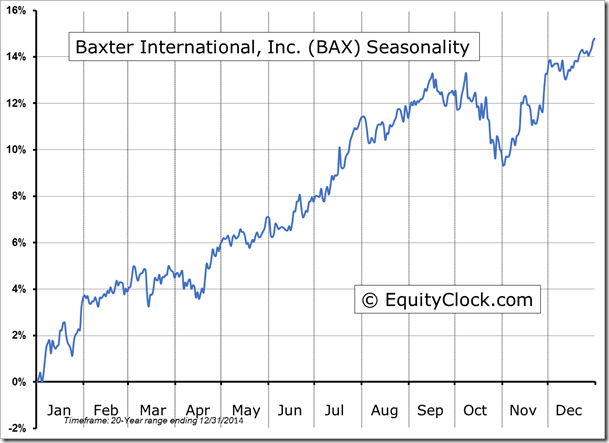
Stocks Entering Period of Seasonal Strength Today:
Exxon Mobil (NYSE:XOM) Seasonal Chart
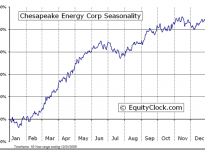
Chesapeake Energy Corporation (NYSE:CHK) Seasonal Chart
The Markets
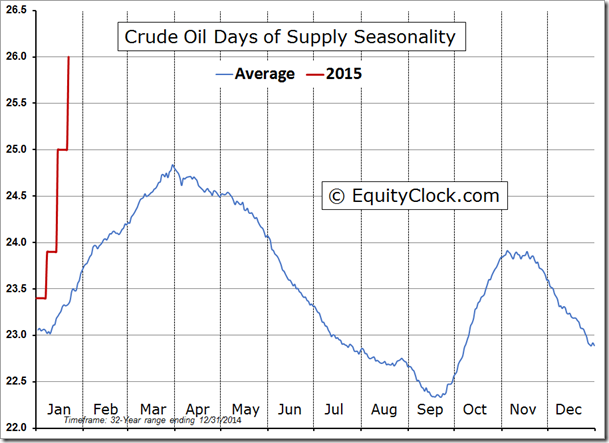
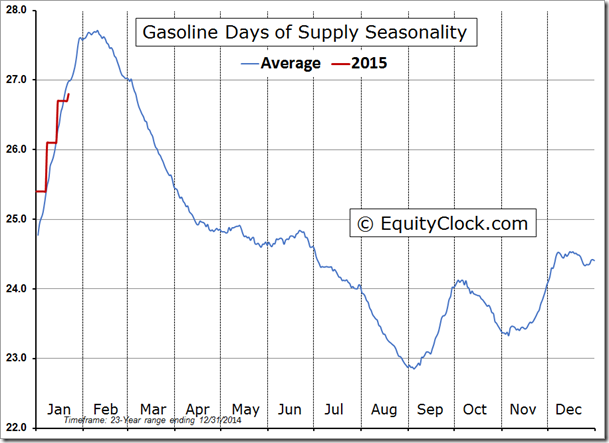
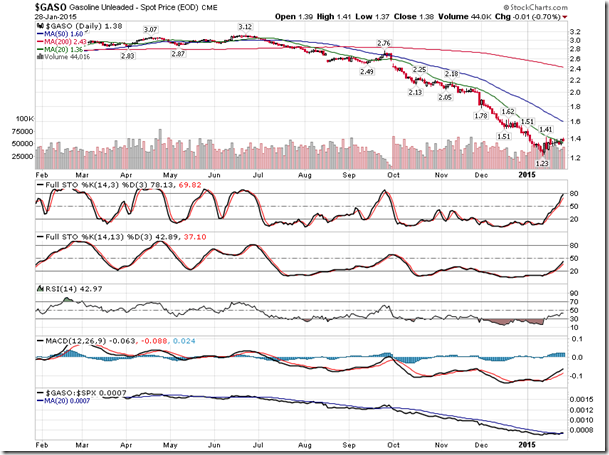
Stocks took a beating on Wednesday, led by sharp declines in the energy sector, which took another hit following a much larger than expected build in oil inventories for the recent week. Commercial Crude Oil stocks now sit at 406.7 Million barrels, the highest level in decades. Put in terms of days of supply, the print of 26 days sits at the upper end of the range from the past four years, but still well off of the highs of around 35 days recorded during the 1980’s. The current level is well above the number of days of supply for this time in January, which averages 23.6. Conversely, the number of days of supply of Gasoline is just below the seasonal average for the past 23 years. At 26.8 days, the supply of Gasoline is presently less than the end of January average of 27.5 days.
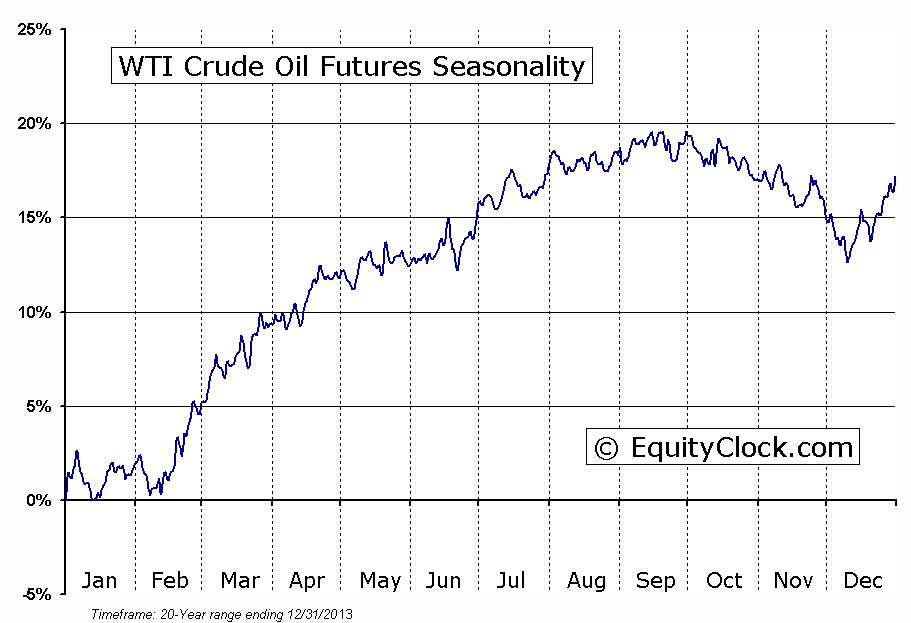
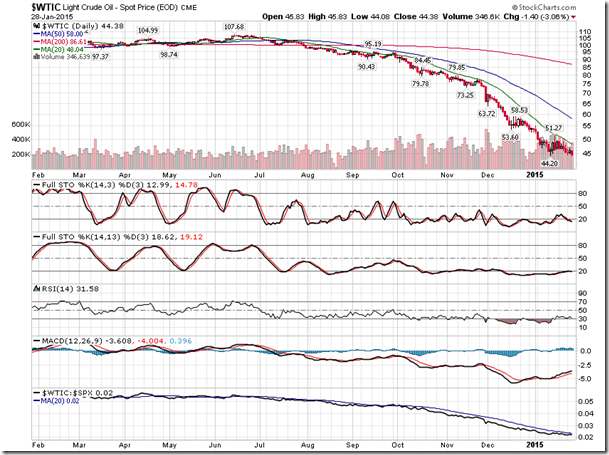
Still, with Oil out of whack compared to seasonal averages and gasoline just below the norm for this time of year, both commodities recorded pronounced declines during Wednesday’s session; the price of gasoline and Crude Oil are trading around 60% below where they were last June. Seasonal tendencies for the price of oil and gas turn positive in February, just as the supply of gasoline reaches a peak around the second week of the month. It appears that the gap between supply and demand for the energy commodities still needs to narrow before a sustainable rise in price is realized.
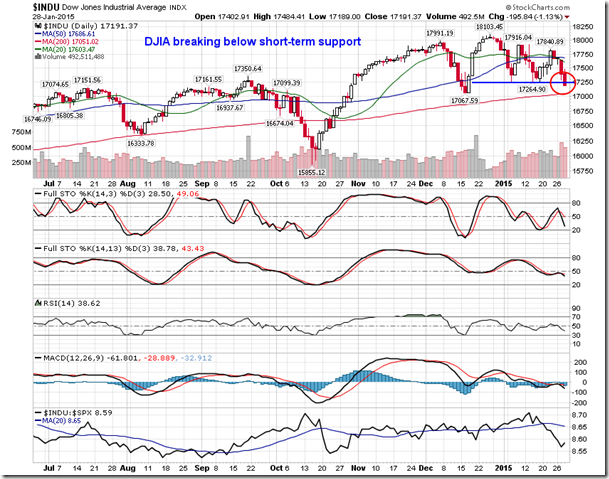
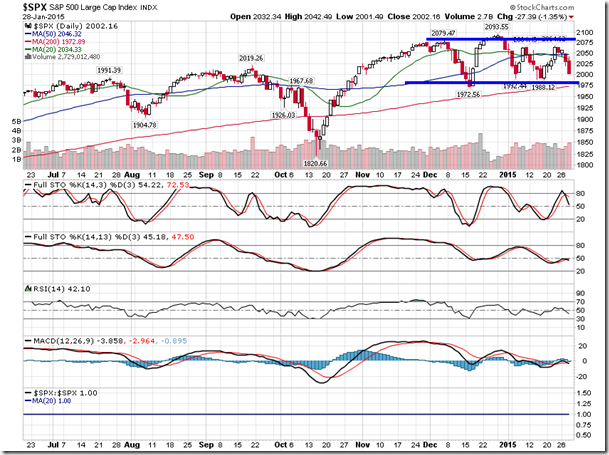
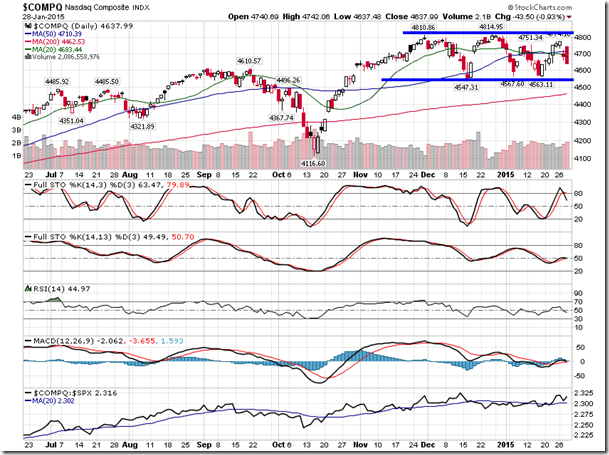
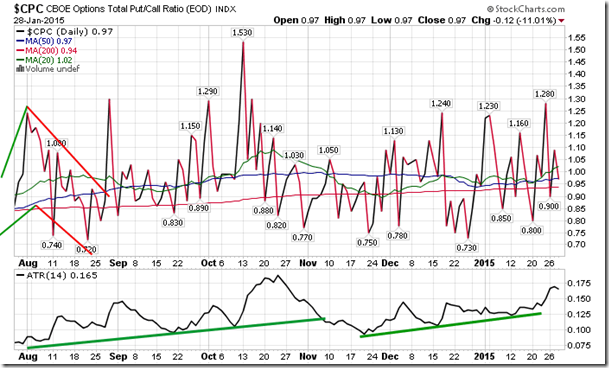
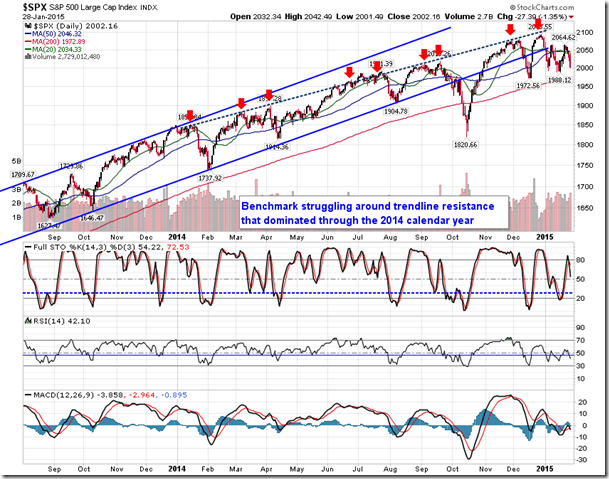
The sell off in equities on Wednesday pushed the Dow Jones Industrial Average below short-term support at 17,265; other benchmarks, including the S&P 500 Index, NASDAQ, and NYSE Composite, continue to remain within a tight trading range. As the put-call ratio has been indicating over the last few weeks, investors continue to debate the next move for equity indices, whether it be higher or lower. Equity prices can remain volatile into February as investors continue to digest earnings.
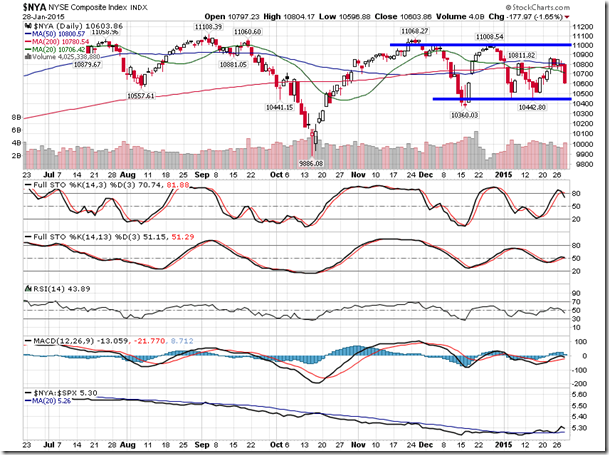
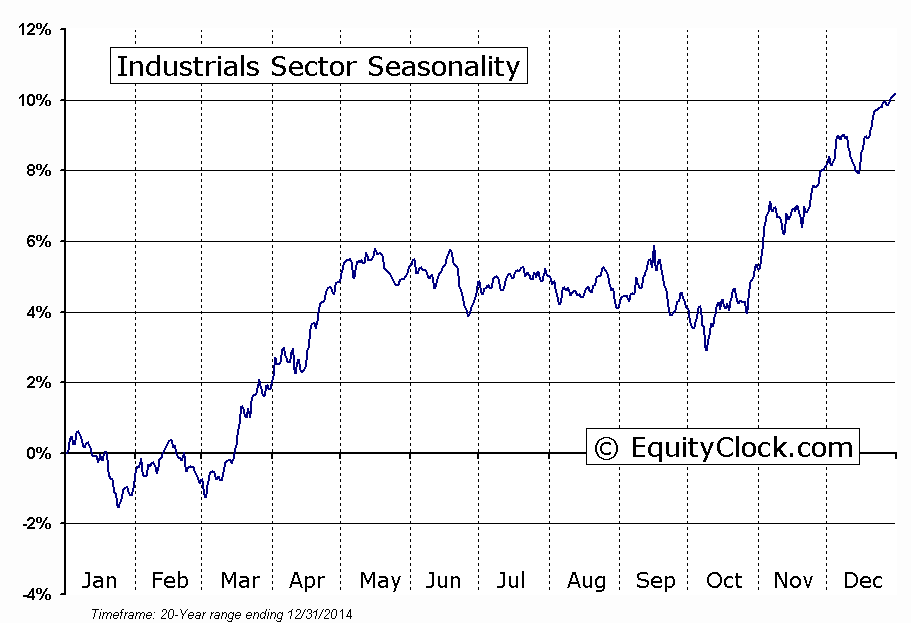
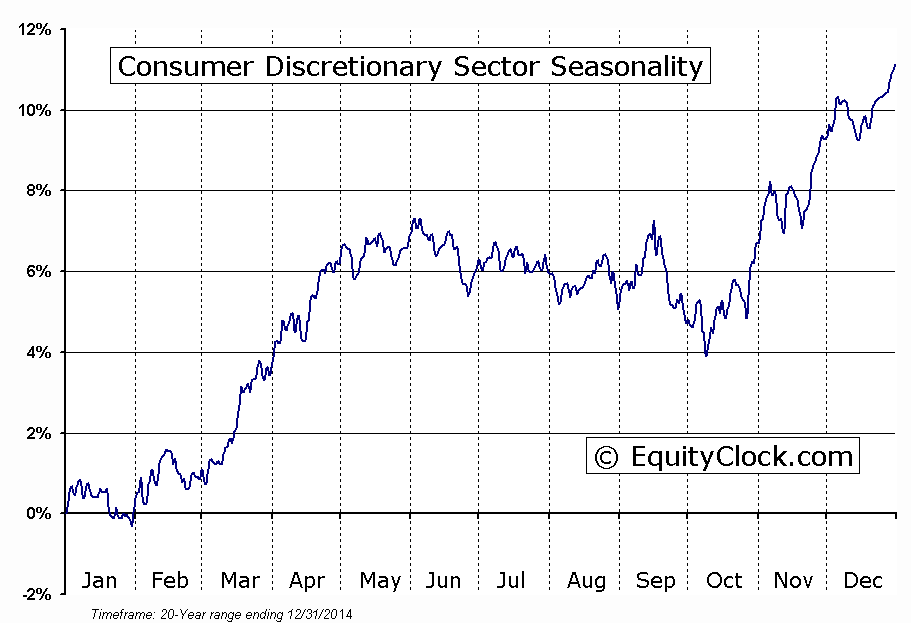
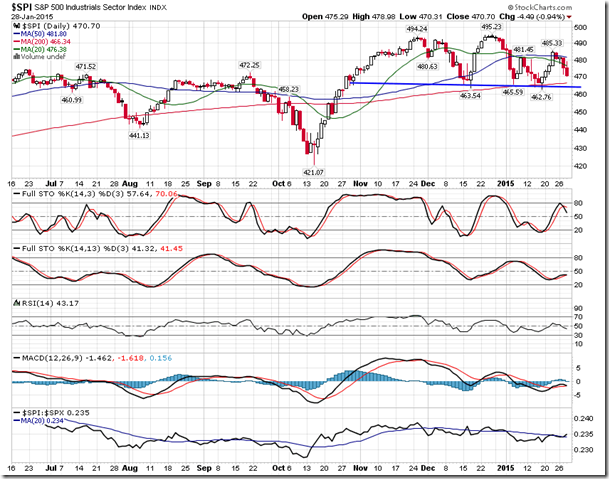
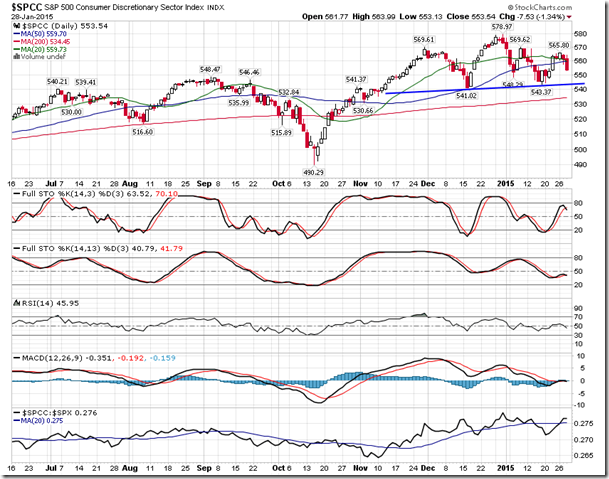
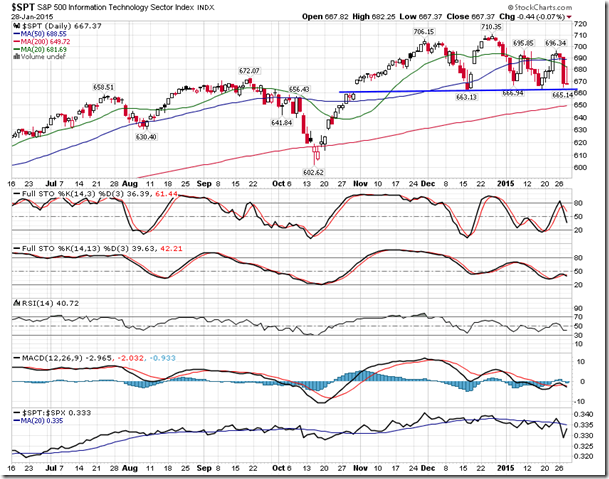
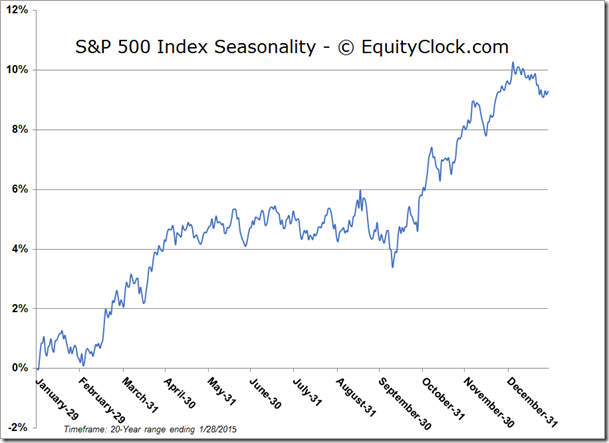
And while the levels of resistance and support continue to be monitored for the major equity indices, there now appears to be a risk of head-and-shoulders topping patterns forming on the charts of major sector benchmarks. The hint of a lower high on the charts of the Industrial, Consumer Discretionary, and Technology sector benchmarks could be setting up this bearish pattern, which would be confirmed upon a break below support at the January lows. Downside potential falls within the range of 6% to 9% for each sector, enough to classify the decline from the December peak as a correction. The Industrial and Consumer Discretionary sectors remain seasonally positive through to April and May.
Sentiment on Wednesday, as gauged by the put-call ratio, ended close to neutral at 0.97.
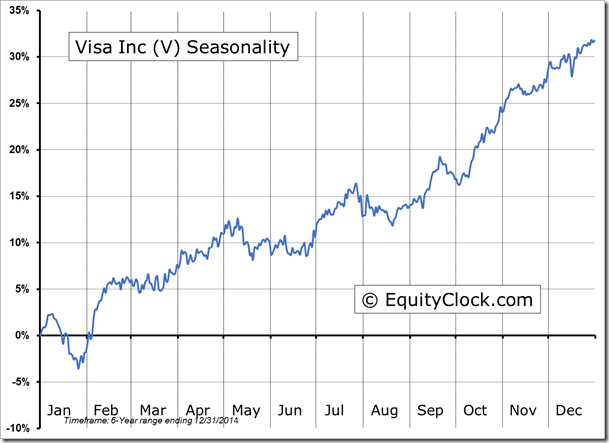
Seasonal charts of companies reporting earnings today:
S&P 500 Index
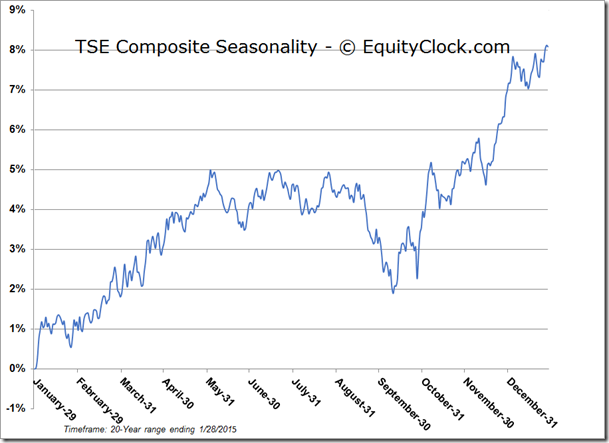
TSE Composite
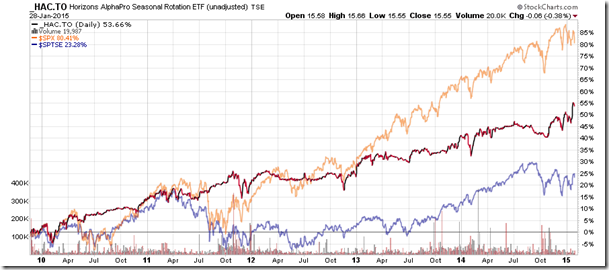
Horizons Seasonal Rotation ETF (TO:HAC)
- Closing Market Value: $15.55 (down 0.38%)
- Closing NAV/Unit: $15.54 (down 0.46%)
Performance*
| 2015 Year-to-Date | Since Inception (Nov 19, 2009) | |
| HAC.TO | 2.71% | 55.4% |
* performance calculated on Closing NAV/Unit as provided by custodian
Disclaimer: Stocks highlighted are for information purposes only and should not be considered as advice to purchase or to sell mentioned securities. As always, the use of technical and fundamental analysis is encouraged in order to fine tune entry and exit points to average seasonal trends.

