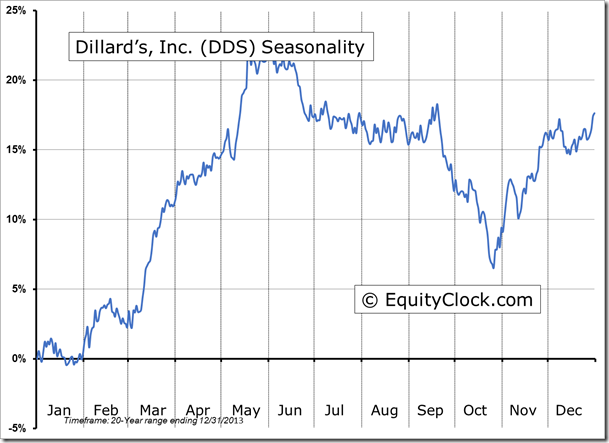
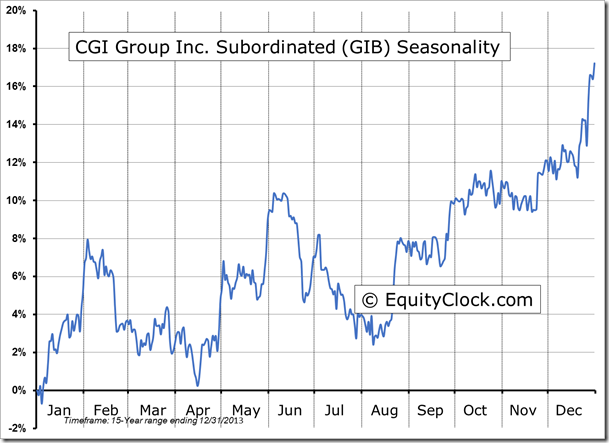
**NEW** As part of the ongoing process to offer new and up-to-date information regarding seasonal and technical investing, we are adding a section to the daily reports that details the stocks that are entering their period of seasonal strength, based on average historical start dates. Stocks highlighted are for information purposes only and should not be considered as advice to purchase or to sell mentioned securities. As always, the use of technical and fundamental analysis is encouraged in order to fine tune entry and exit points to average seasonal trends.
Stocks Entering Period of Seasonal Strength Today:
-
No stocks identified for today.
The Markets
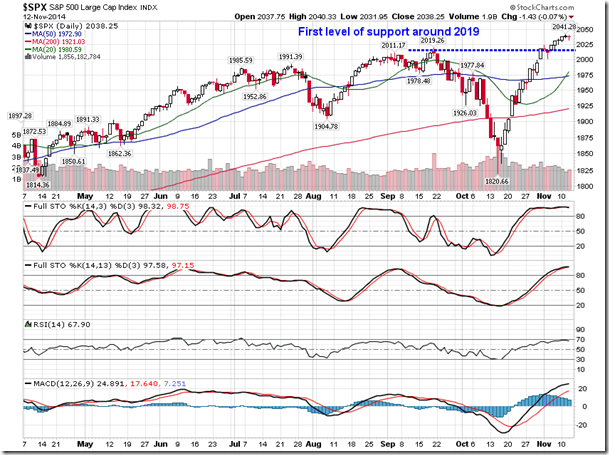
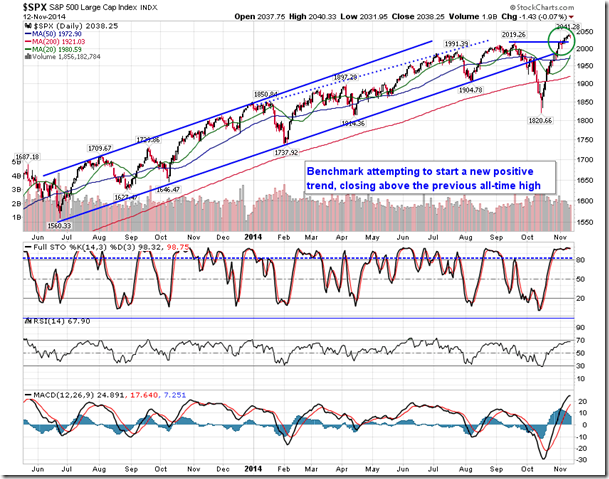
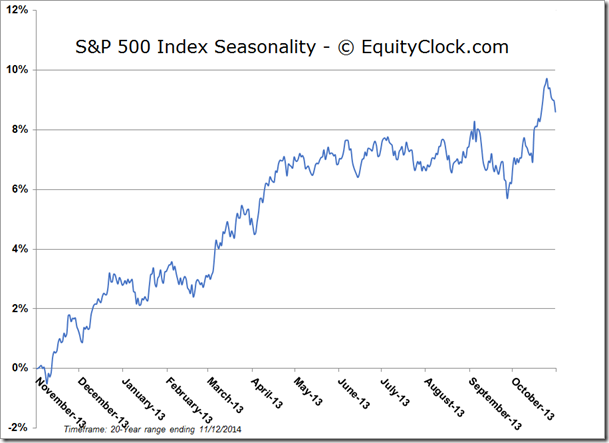
Stocks ended mixed on Wednesday, ending a 5-day win streak that saw the S&P 500 chart new highs. The large-cap benchmark remains overbought, trading over 3% above its 20-day moving average over the past five sessions. This is the second time this year that the US equity benchmark has been stretched to this extent above this short-term moving average, the last being at the start of July, prior to the brief pullback of around 4%. As of last Thursday, in combination with the stretched condition above the 20-day average, the US equity market was also the most stretched above its 50-day moving average since October 28 of 2011. Stocks subsequently pulled back by around 10% in the weeks that followed as equity markets unwound the stretched condition. The good news for long-term investors is that short-term pullbacks that have resulted from the stretched condition have frequently allowed for appealing buying opportunities for further gains in the months that followed. First level of support for the S&P 500 Index can be found at the broken level of resistance around 2019.
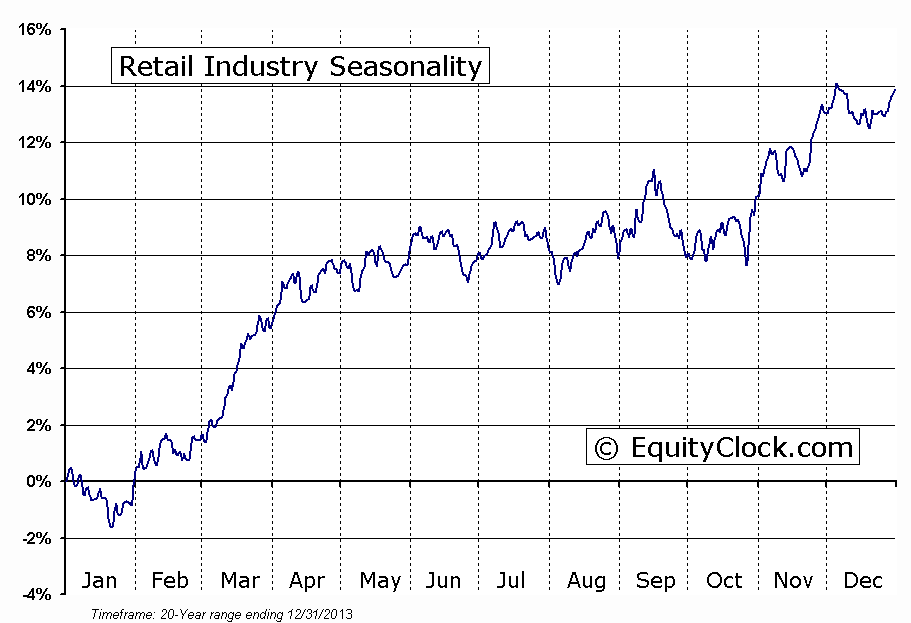
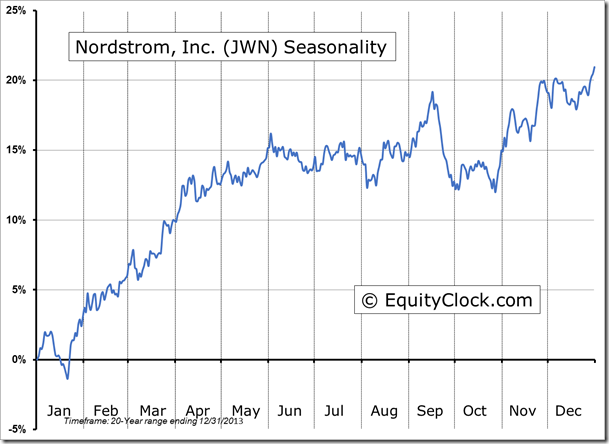
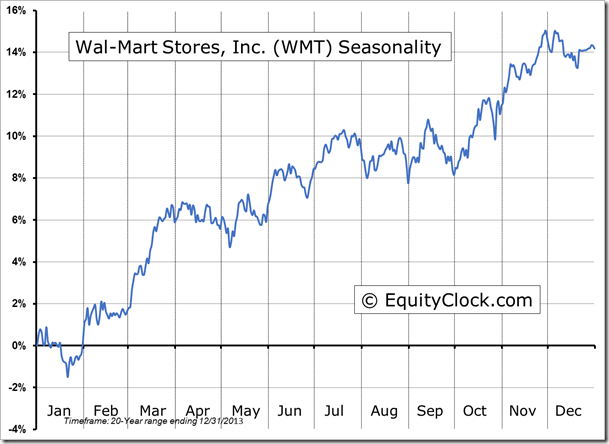
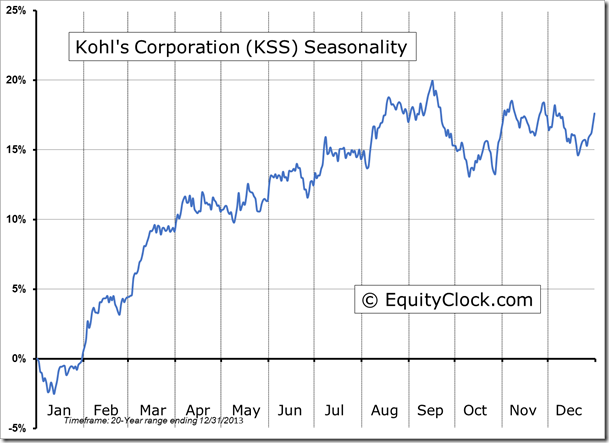
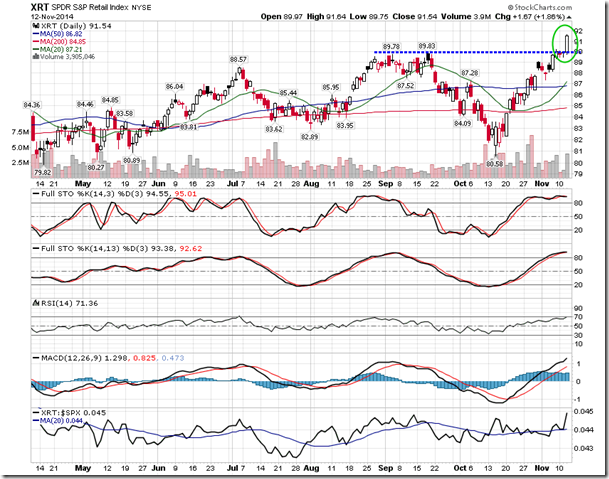
Despite the lacklustre session for broad market benchmarks, activity was notable in the retail sector, which topped the leaderboard and charted new all-time highs, as indicated by the S&P Retail Index ETF (SPDR S&P Retail (NYSE:XRT)). The gain of 1.86% in shares of XRT followed strong earnings from Macy's Inc (NYSE:M) and Fossil Group Inc (NASDAQ:FOSL); reports from Nordstrom Inc (NYSE:JWN), Kohl's Corporation (NYSE:KSS), and Wal-Mart Stores Inc (NYSE:WMT) are expected to be released today. The retail industry remains in a period of seasonal strength through to the Thanksgiving holiday, after which underperformance versus the market is typical through the end of the year. The industry enters its next period of seasonal strength in late January.
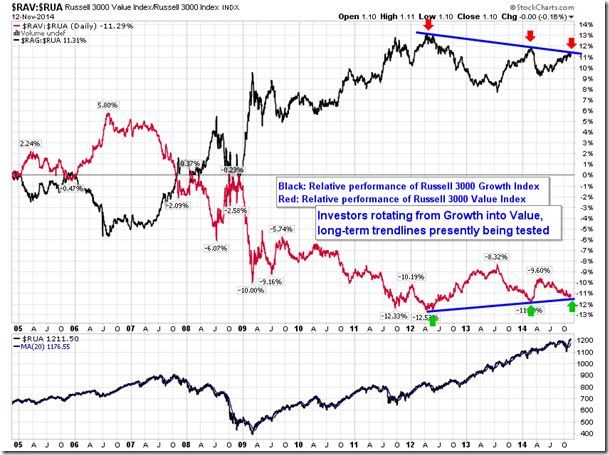
Earlier this year we highlighted the apparent shift away from growth stocks and into value, as indicated by the relative performance of the Russell 3000 Value and Growth indexes. Growth stocks peaked relative to the market in May of 2012, while Value stocks hit a relative low. This turning point marked the end of the almost six year trend of outperformance for growth stocks, leading to the emerging trend of outperformance in value. Fast forward to April of this year, the intermediate trend has moved counter to the longer-term trend as growth stocks once again took a leadership role. The countertrend has reached a pivotal point at the longer-term trendlines that were established back in 2012. A breakout or breakdown appears imminent. Growth stocks may have a tough time breaking above the long-term trend; growth stocks typically underperform value stocks between mid-November and the end of the year. The relative trend warrants monitoring as momentum stocks, which are predominantly constituents of the growth side of the equation, have captured a lot of attention amongst investors as they gamble on future earnings that may take years to be realized; an abrupt shift away from momentum names would fuel a selloff similar to March/April of this year.
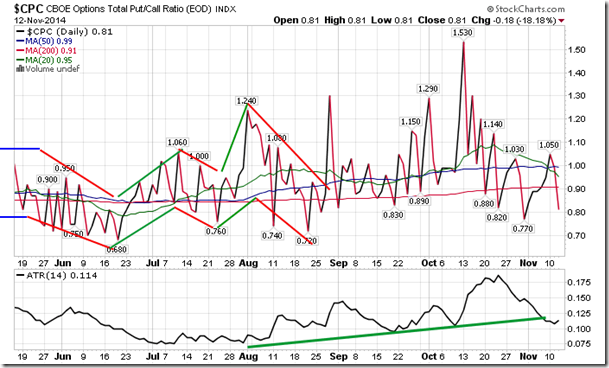
Sentiment on Wednesday, as gauged by the put-call ratio, ended bullish at 0.81.
Sectors and Industries entering their period of seasonal strength:

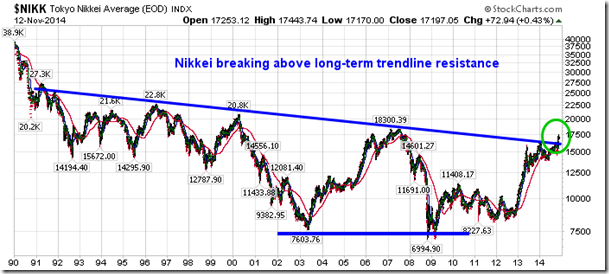
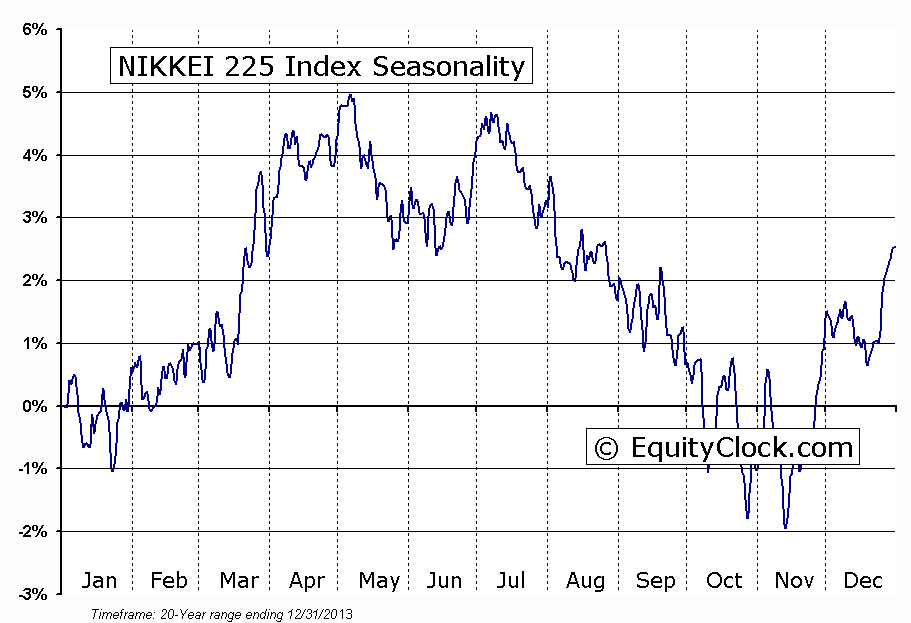
We profiled the Nikkei Average at the beginning of the month, highlighting the period of seasonal strength for the benchmark ahead that runs from November through to May for an average gain of around 8%. At the time, the benchmark was pushing up against long-term resistance, a level that has been holding back the benchmark for decades. The Nikkei has now recorded a move above the key declining trendline, suggesting a change of the long-term trend from negative to positive. The benchmark also broke above double-top resistance around 16,300, which had established the highs of the year. With new 52 week highs upon us and favourable seasonal tendencies over the next six months, the outlook for the Japanese benchmark looks promising. Next significant level of resistance is apparent at the 2007 high of 18,300, a level that if broken would imply upside potential to 30,000, based on the long-term double bottom pattern that became apparent last decade.The benchmark is presently overbought and vulnerable to a retracement of some magnitude, potentially allowing for appealing buying levels down the road.
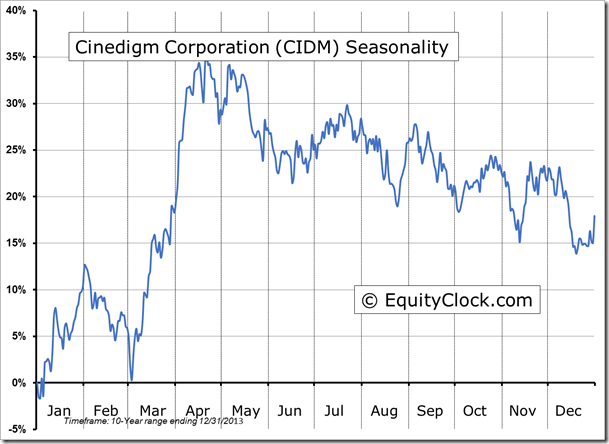
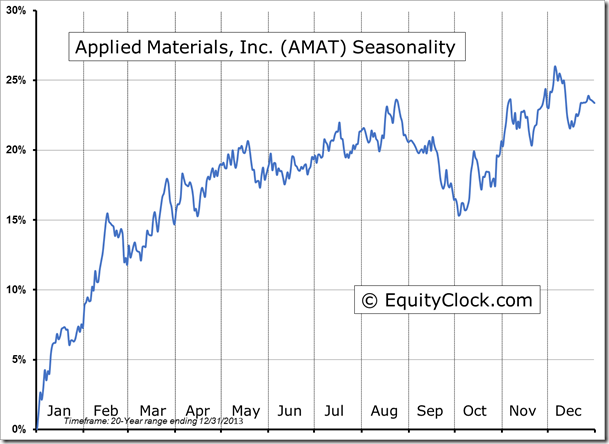
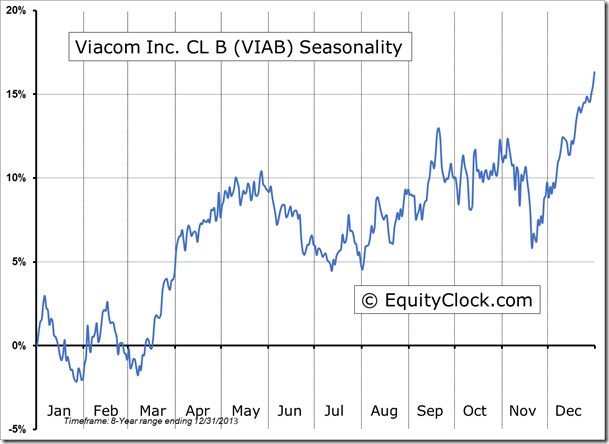
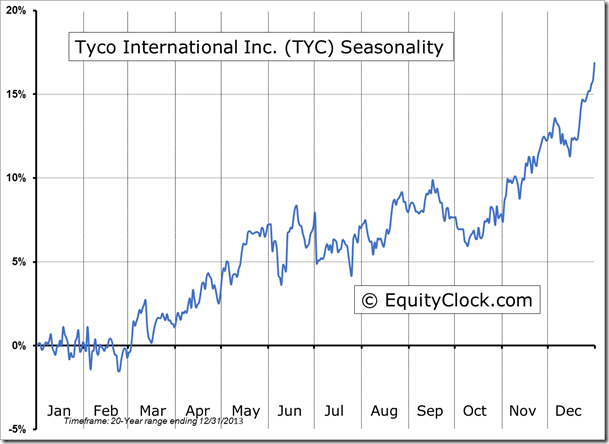
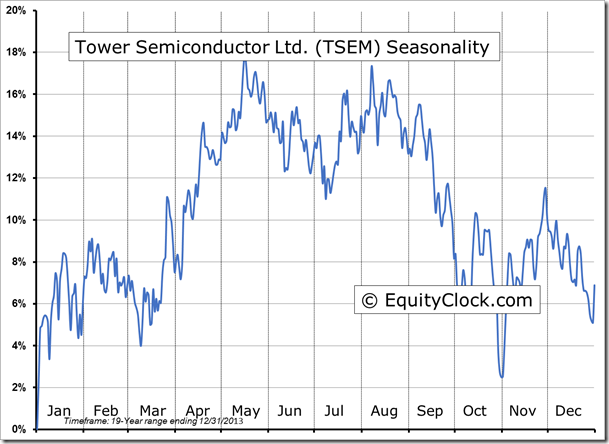
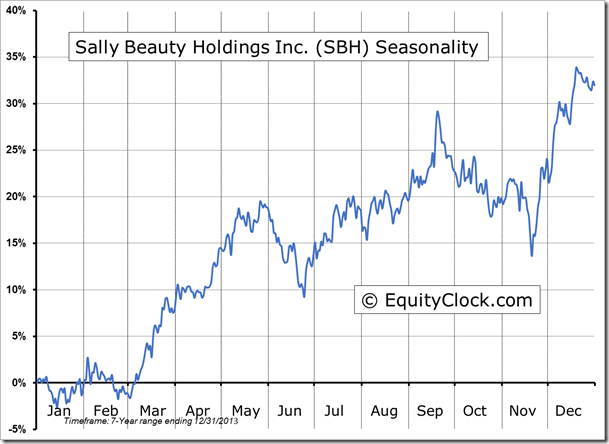
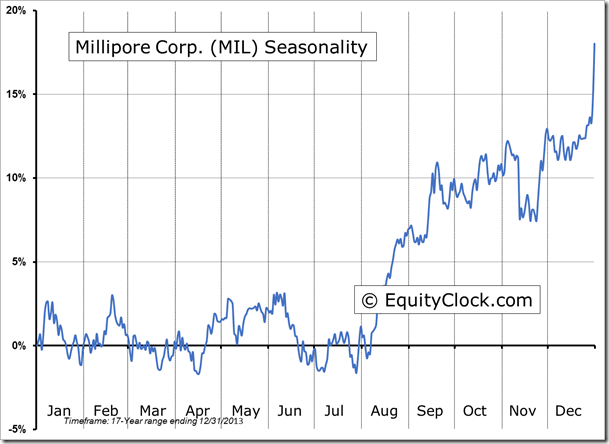
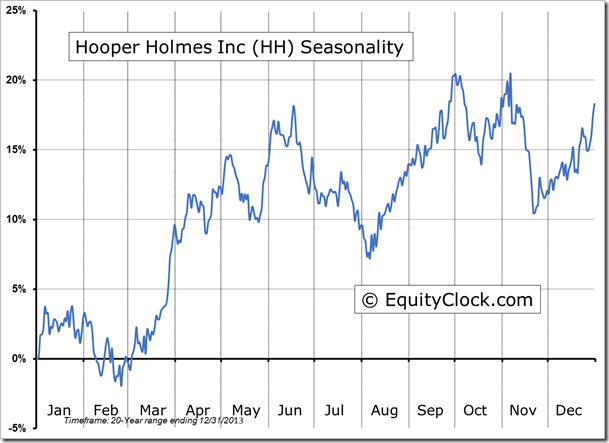
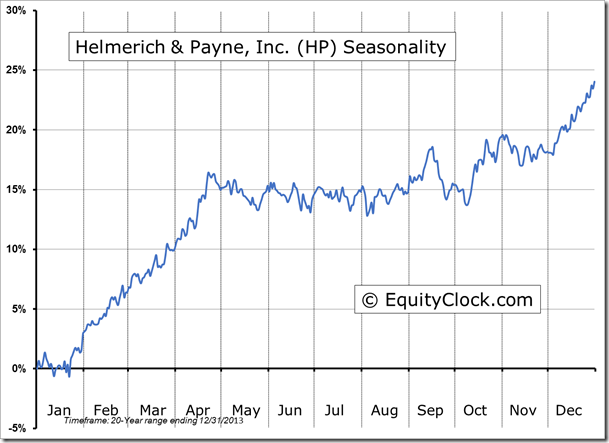
Seasonal charts of companies reporting earnings today:
S&P 500 Index
TSE Composite
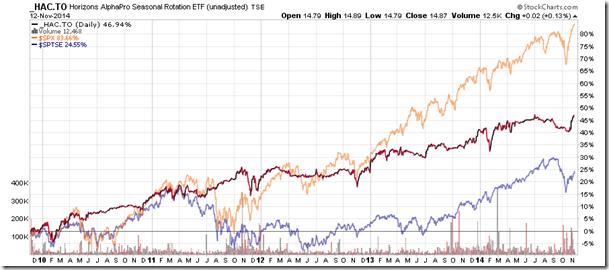
Horizons Seasonal Rotation ETF (TO:HAC)
- Closing Market Value: $14.87 (up 0.13%)
- Closing NAV/Unit: $14.89 (up 0.18%)
Performance*
| 2014 Year-to-Date | Since Inception (Nov 19, 2009) | |
| HAC.TO | 4.13% | 48.9% |
* performance calculated on Closing NAV/Unit as provided by custodian
