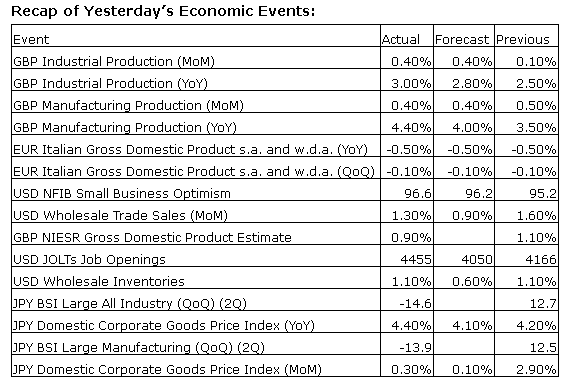
Upcoming US Events for Today:- Weekly Crude Inventories will be released at 10:30am.
- Treasury Budget for May will be released at 2:00pm. The market expects –$139.0B versus $106.9B previous.
Upcoming International Events for Today:
- Great Britain Labour Market Report for May will be released at 4:30am EST. The market expects the Claimant Count to decline by 25,000 versus a decline of 25,100 previous. The Unemployment Rate is expected to tick lower to 6.7% versus 6.8% previous.
- Japan Machine Orders for April will be released at 7:50pm EST. The market expects a year-over-year increase of 13.7% versus 20.1% previous.
The Markets
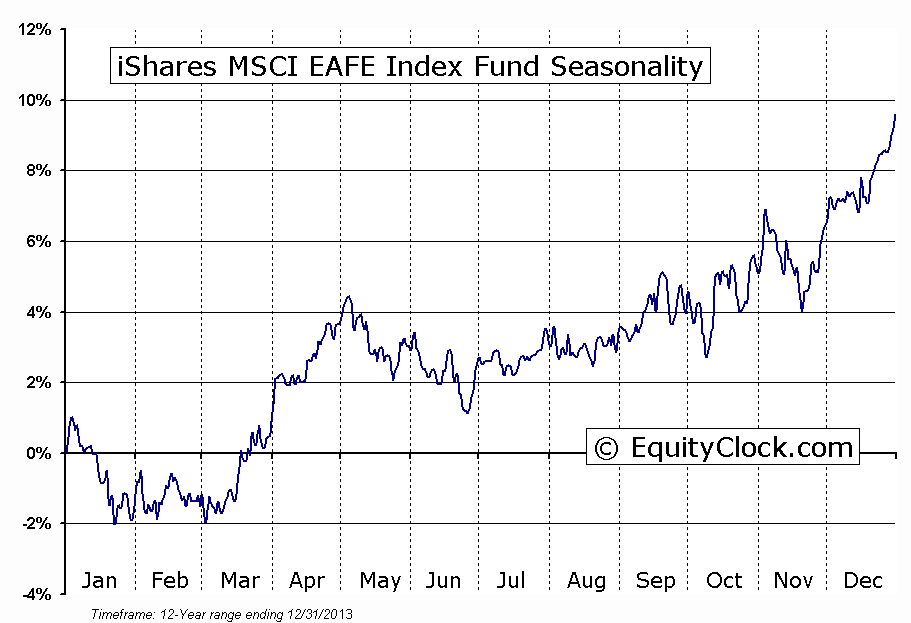
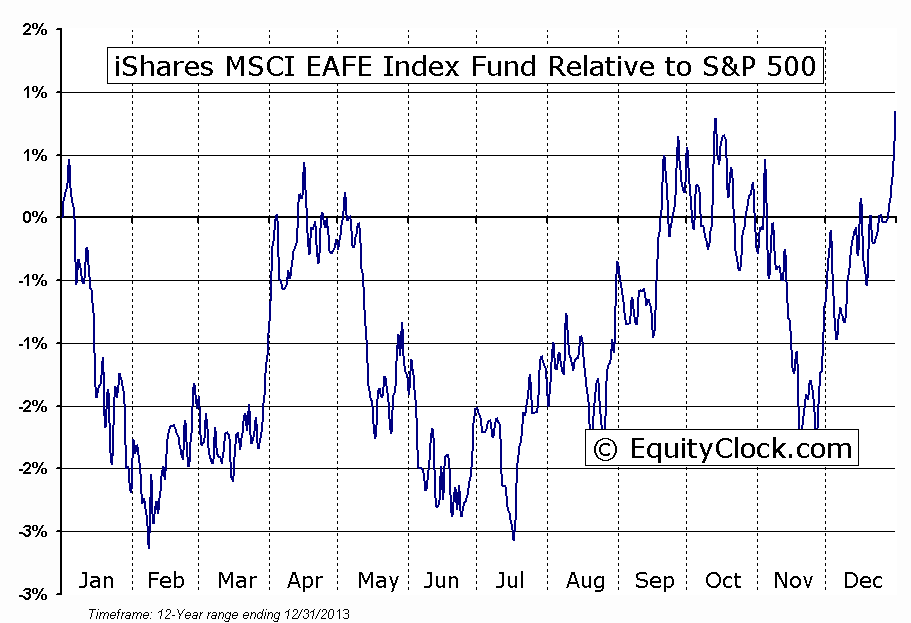
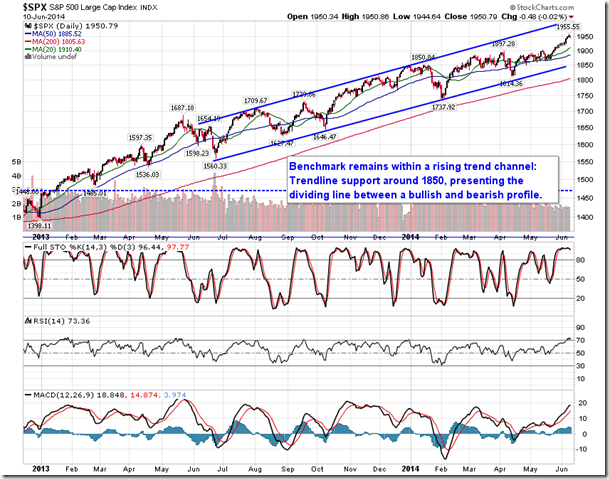
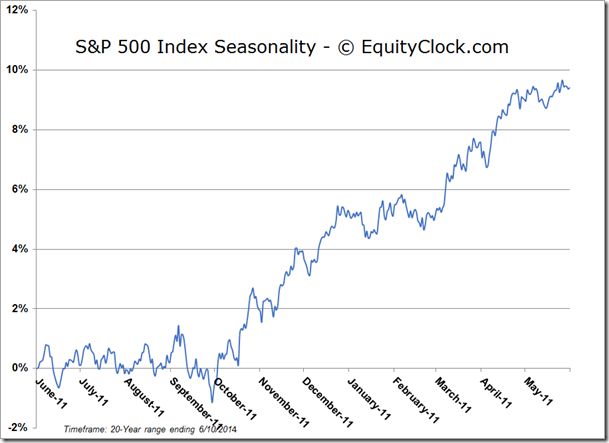
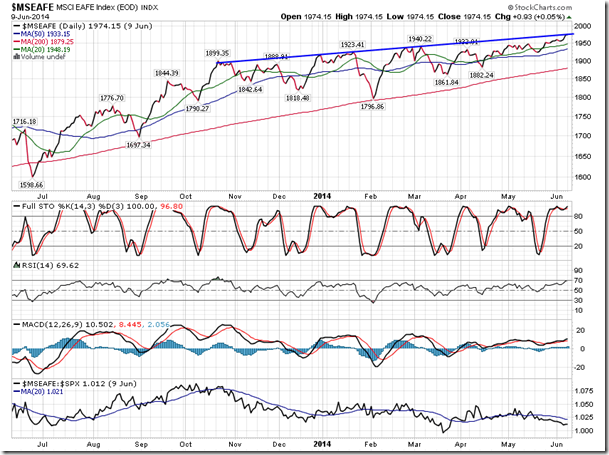
Stocks ended flat on Tuesday as investors start to show signs of buying exhaustion as they wait for the next market moving catalyst. The Dow Jones Industrial Average closed higher by a mere 2.82 points, finishing the session at a new all-time high, while the S&P 500 Index ended off its all-time peak by a mere half point. European benchmarks have also been strong performers following the ECB’s recent rate cut. The FTSE MIB, IBEX, and DAX are all charting 52 week highs; the MSCI EAFE is now battling with trend-line resistance around 1975 as technical indictors hover around overbought levels. Over the past 12 years, the iShares MSCI EAFE Index Fund (ARCA:EFA) has been seasonally negative in the month of June before finding a low at the start of the summer season. The benchmark typically trends positive between July and October, just as US benchmarks are showing the greatest volatility. The EAFE has gained 4%, on average, between July and October, a period when flat to negative returns for US equity benchmarks is the norm. The benchmark is currently underperforming the S&P 500 index, however, the period of seasonal outperformance is right around the corner.
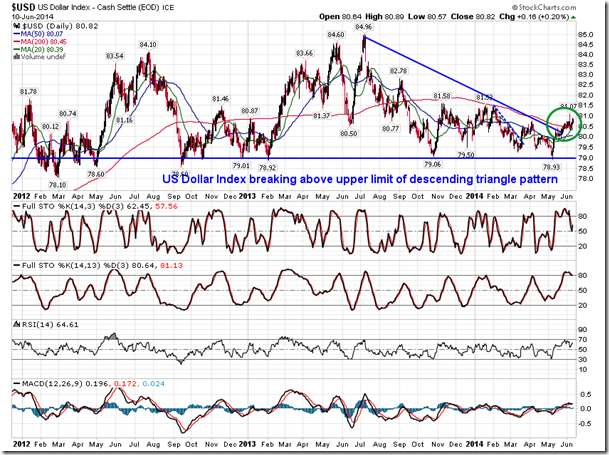
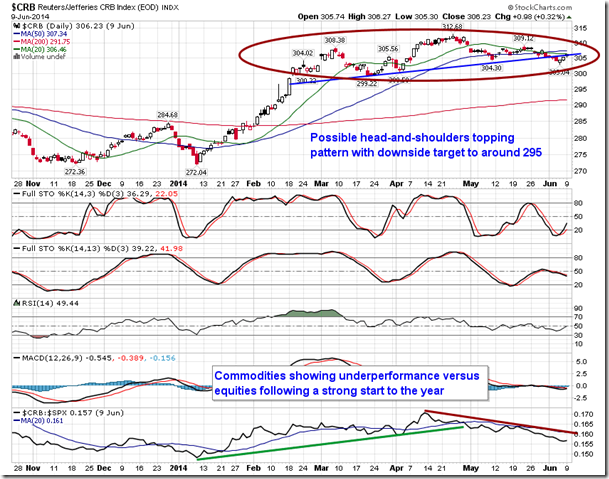
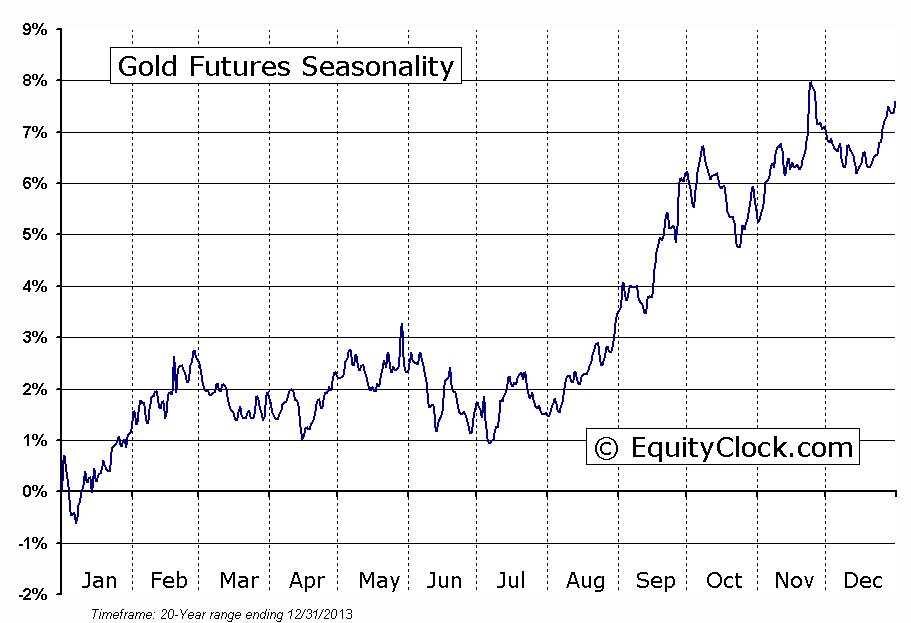
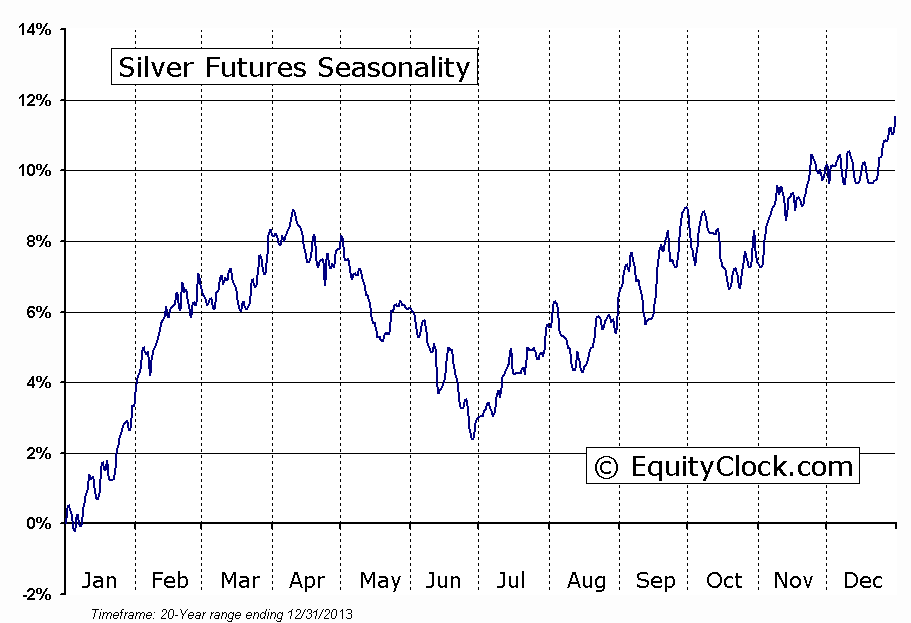
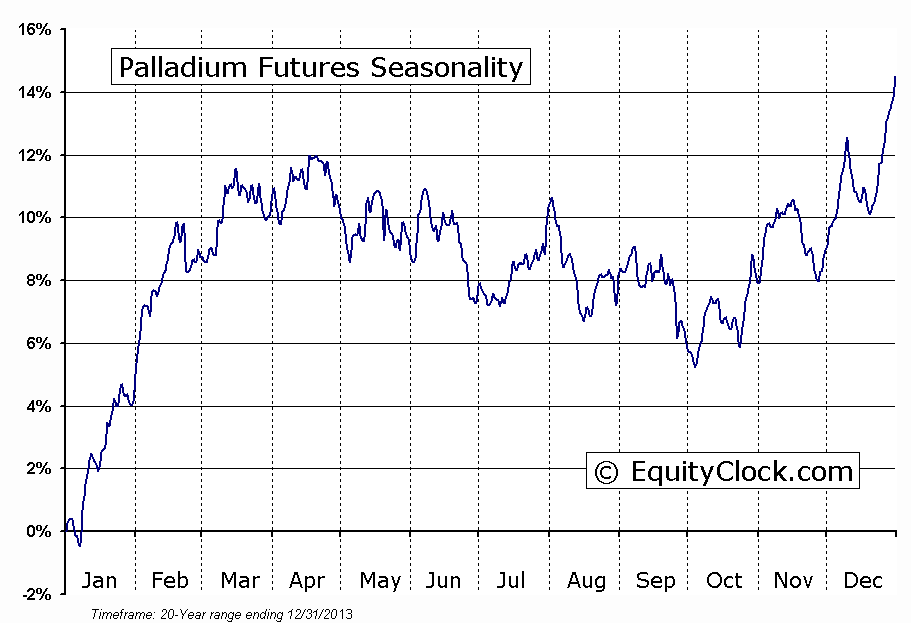
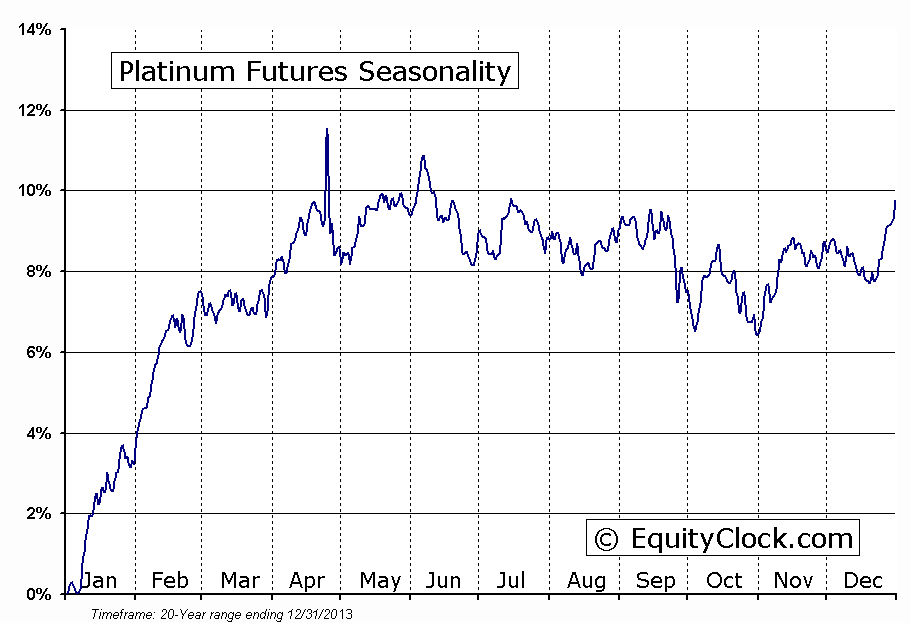
One of the factors influencing global asset prices has been the movement in the US Dollar, which continues to break above trend-line resistance, as well as its 200-day moving average. The trend has shifted from neutral to positive, hindering the commodity market, which has shown recent underperformance versus equities after a strong start to the year. Commodities remain in a period that is generally considered to be the weakest of the year with lower prices in a wide variety of assets typical through the month of June. Seasonal strength for Gold and Silver typically begin around the start of July, while weakness in industrial commodities, such as Platinum and Palladium, start a period of seasonal weakness around this time of year.
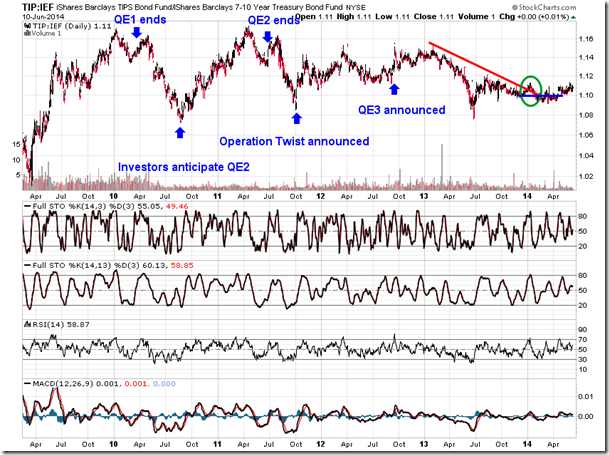
Potentially acting as a catalyst for the upcoming Gold seasonal trade is the uptick in inflation expectations, as gauged by the ratio of the Treasury Inflation Protected ETF versus the 7 – 10 Year Treasury Bond Fund. The ratio found support this past winter and major moving averages have recently started to curl positive. Positive inflation expectations are typically beneficial for the yellow metal as a hedge against rising prices. Investors should take note, however, that inflation expectations have turned lower upon the conclusion of each quantitative easing program in the US. With the Fed poised to bring an end to their bond buying program as it attempts to unwind stimulus, a similar decline in inflation expectations this time around cannot be ruled out. For now, investors appear undeterred by the imminent conclusion of simulative policies in the US.
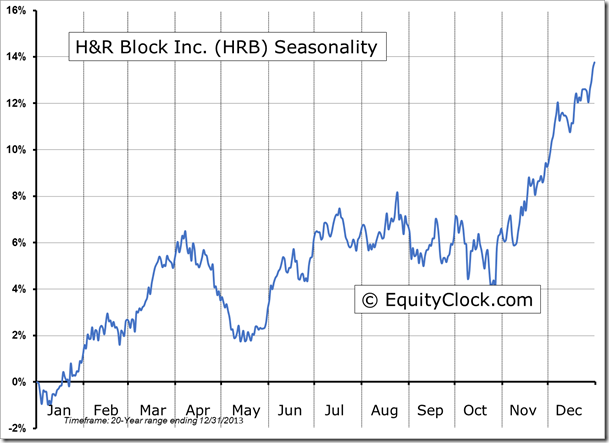
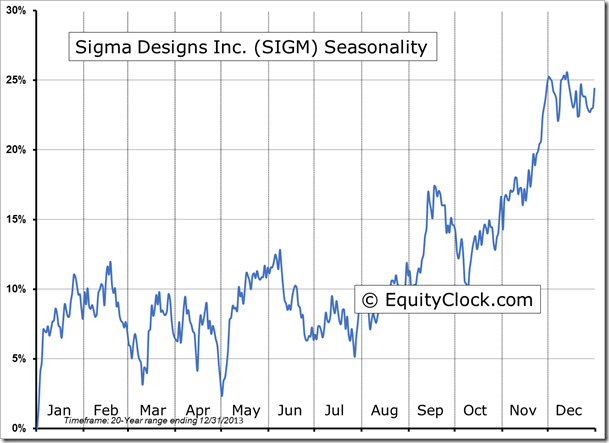
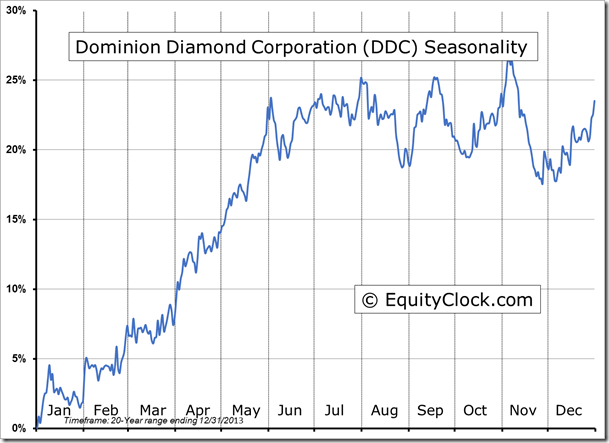
Seasonal charts of companies reporting earnings today:
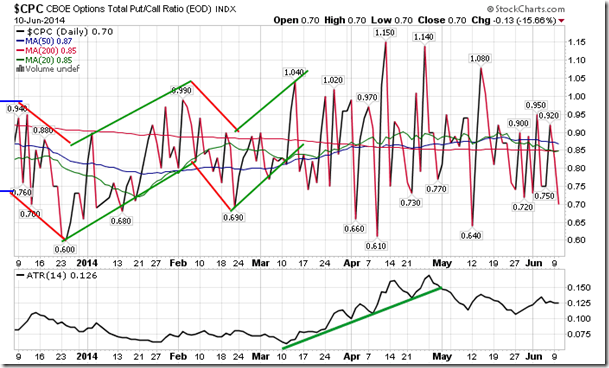
Sentiment on Tuesday, as gauged by the put-call ratio, ended bullish at 0.70. The ratio is hovering around the lower end of the bullish spectrum, typically a short-term contrarian signal that the market has become too bullish for its own good, often a precursor to near-term declines.
S&P 500 Index
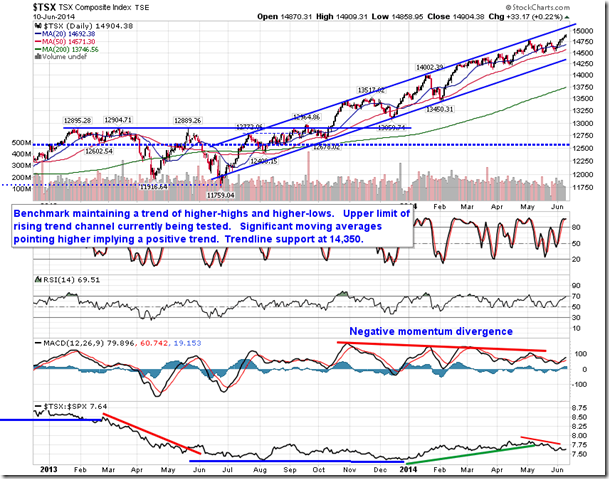
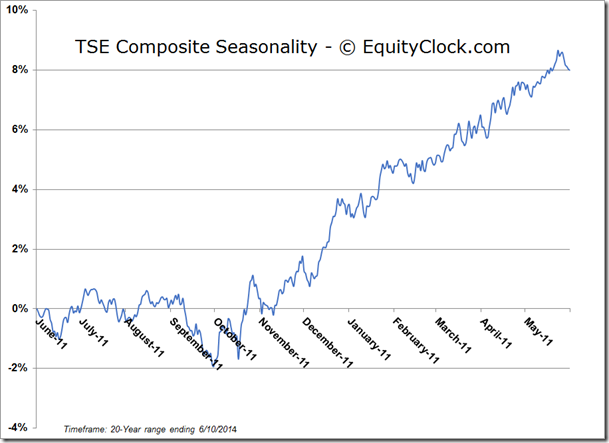
TSE Composite
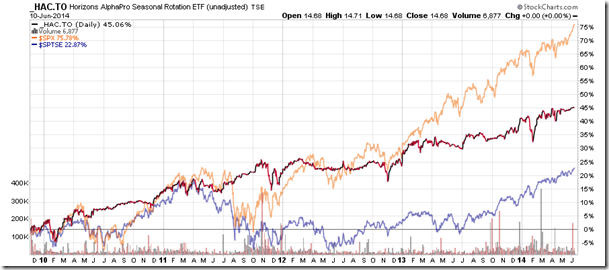
Horizons Seasonal Rotation ETF (TSX:HAC)
- Closing Market Value: $14.68 (unchanged)
- Closing NAV/Unit: $14.68 (down 0.05%)
Performance*
| 2014 Year-to-Date | Since Inception (Nov 19, 2009) | |
| HAC.TO | 2.66% | 46.8% |
* performance calculated on Closing NAV/Unit as provided by custodian
