Upcoming US Events for Today:
- Weekly Crude Inventories will be released at 10:30am.
- FOMC Minutes will be released at 2:00pm .
International Events Today:
- Bank of England Minutes released at 4:30am EST.
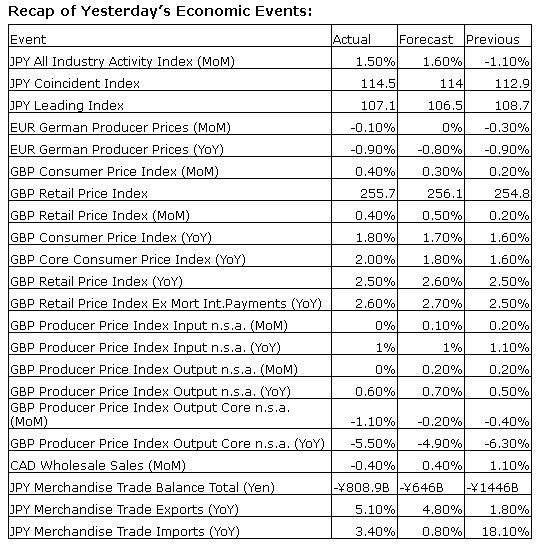
- Great Britain Retail Sales for April released at 4:30am EST. The market expects a year-over-year increase of 5.1% versus an increase of 4.2% previous.
- Eurozone Consumer Confidence for for May released at 10:00am EST. The market expects
- Japan Flash Manufacturing PMI for May released at 9:35pm EST.
- China Flash Manufacturing PMI for May released at 9:45pm EST. The market expects 48.3 versus 48.1 previous.
The Markets
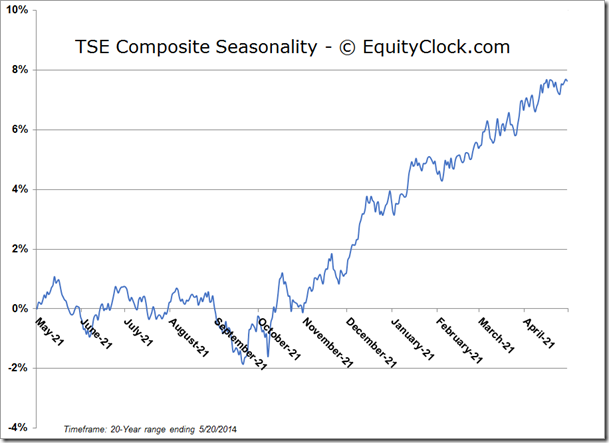
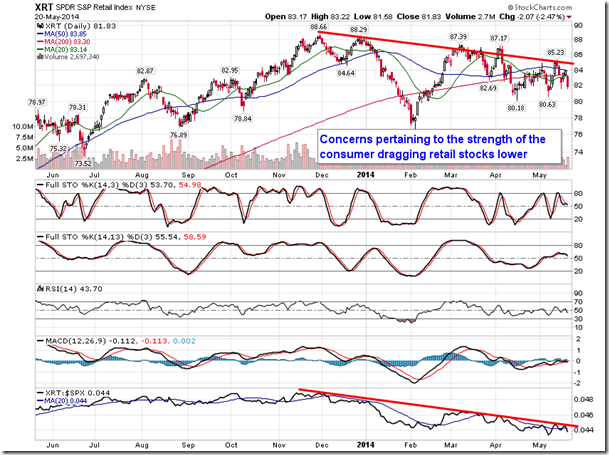
Stocks dipped on Tuesday led by a selloff in the retail sector as disappointing results from Staples (NASDAQ:SPLS) and TJX Companies (NYSE:TJX) fuelled concerns that consumer spending may be slowing. The Retail ETF (NYSE:XRT) declined by 2.47%, trading back below its 200-day moving average. The Discretionary sector, which includes retail, has been the weakest of the nine major market segments this year as disappointing results from consumer oriented companies have investors concerned about the strength of the economy; the unseasonably cold winter weather during the first quarter continues to be cited as a factor. Discretionary is seasonally one of the weakest sectors of the market between May and October, declining by an average of 3.8% over the past 20 years. Retail is already showing a trend of lower-highs and lower-lows, bringing an end to the positive trend that arguably stretched all the way back to the 2009 lows. The consumer helped the equity market recover from the recessionary lows of 2009, will it now lead the market lower from these post-recession highs?
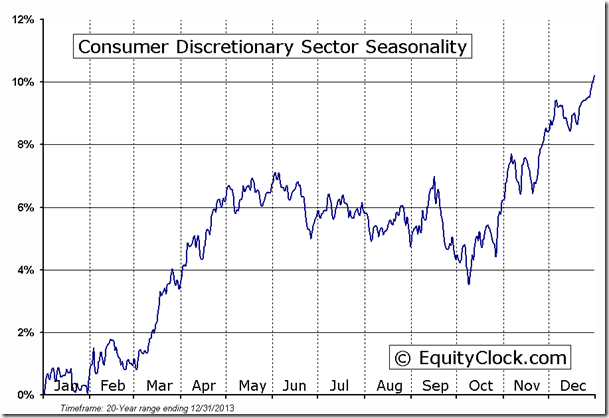
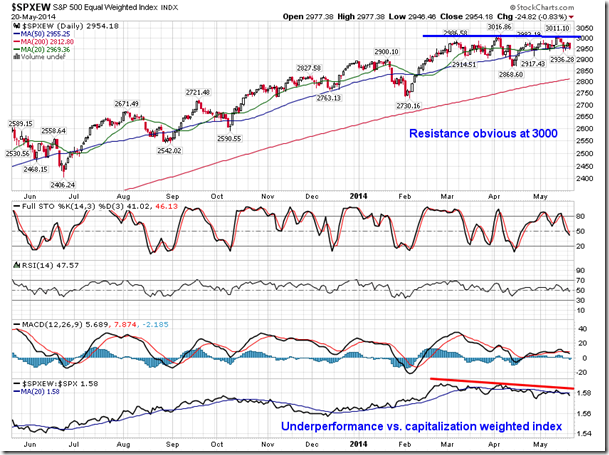
The cyclical, high beta areas of the market, such as Consumer Discretionary, continue to act as a drag on broad equity benchmarks, typically a precursor to much broader weakness ahead. The S&P 500 Equal Weighted Index is already providing warning signs. The benchmark has been underperforming the capitalization weighted index since early March as consumer and financial stocks lag the broad market Resistance for the the equally weighted index appears obvious at 3000 as the price activity and the major moving averages start to flatten. The benchmark is typically viewed as an indication of breadth of the overall market, the strength of which continues to show signs of waning.
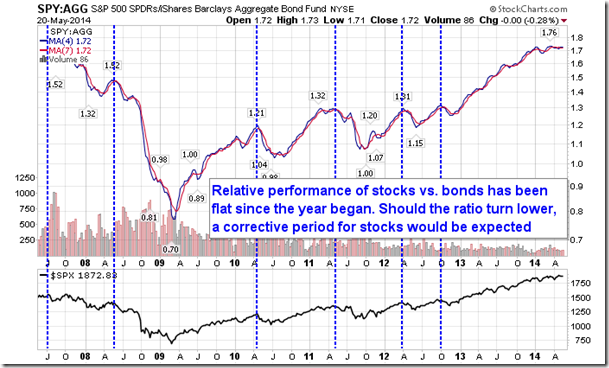
The battle of the year remains between bond and equity markets as investors struggle with the end of the present quantitative easing program. The ratio of the S&P 500 ETF (ARCA:SPY) and the Barclays Aggregate Bond Fund (LONDON:USAG) has been flat since the year began, indicating that the performance between bonds and stocks have been equivalent. The ratio is useful in order to determine trends towards equities or fixed income instruments: as one market strengthens, the other weakens. The outperformance of bonds relative to stocks can often be both a leading and coincident indicator of equity market weakness, which, over recent years, has resulted in corrective periods for stocks on 6 distinct occasions. The ratio had maintained a positive trend since the low in the last quarter of 2012, remaining positive through the stellar equity market gains of 2013. The flat relative performance since 2014 began suggests indecision between the two markets, which is neither negative nor positive. Should the ratio turn lower, a corrective period for stocks would be expected.
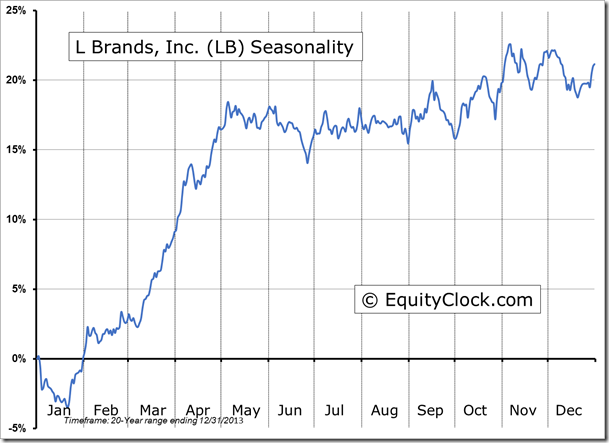
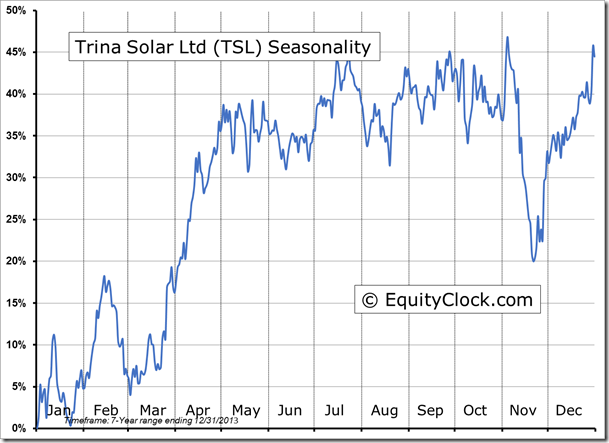
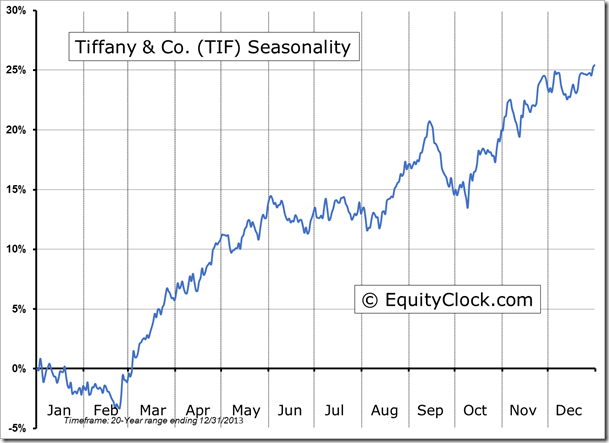
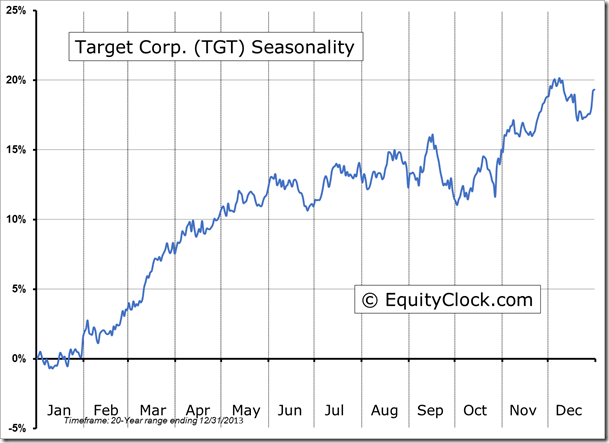
Seasonal charts of companies reporting earnings today:
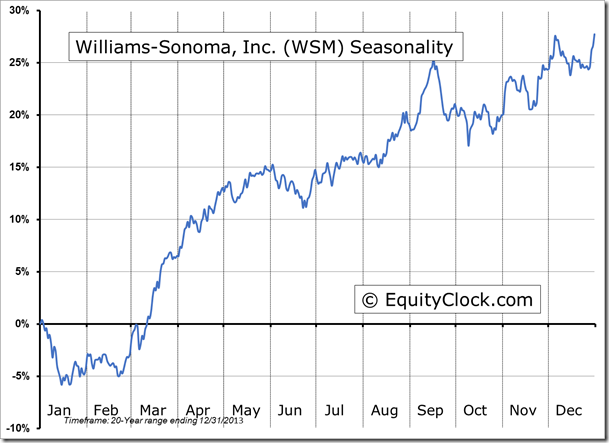
Williams-Sonoma Inc (NYSE:WSM)
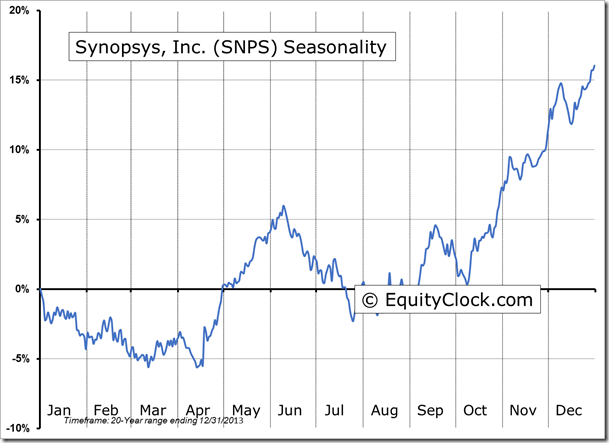
Synopsys Inc (NASDAQ:SNPS)
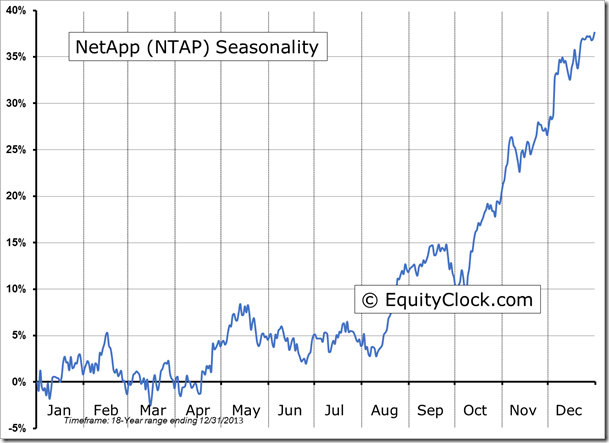
NetApp Inc (NASDAQ:NTAP)
L Brands Inc (NYSE:LB)
Trina Solar Limited (NYSE:TSL)
Tiffany & Co (NYSE:TIF)
Target Corporation (NYSE:TGT)
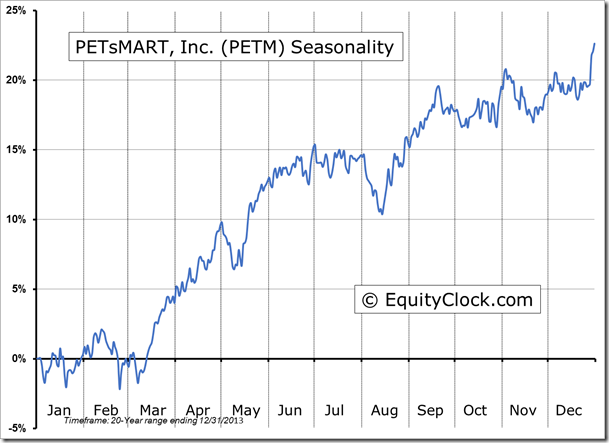
PetSmart Inc (NASDAQ:PETM)
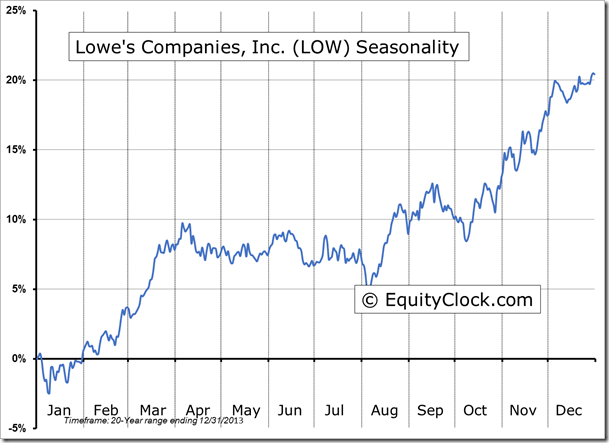
Lowe's Companies Inc (NYSE:LOW)
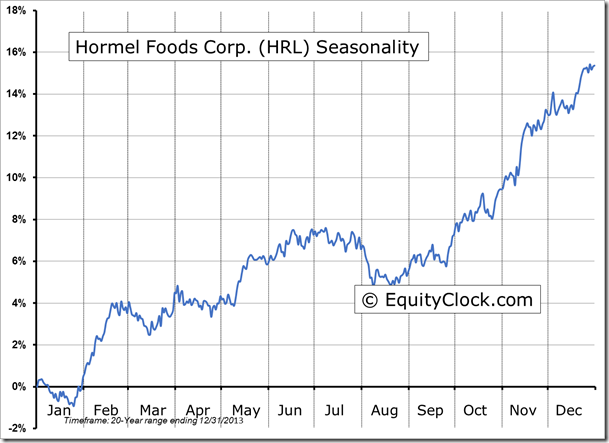
Hormel Foods Corporation (NYSE:HRL)
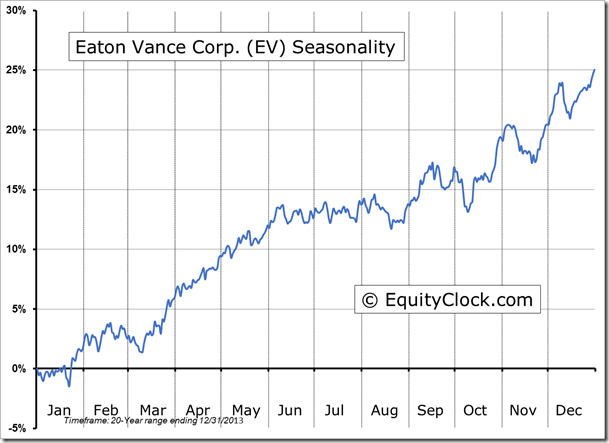
Eaton Vance Corporation (NYSE:EV)
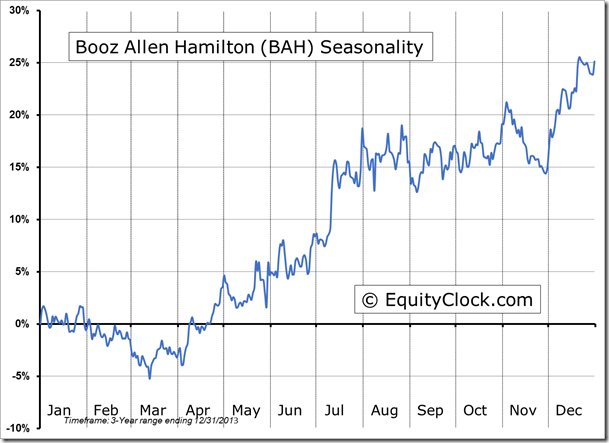
Booz Allen Hamilton Holding (NYSE:BAH)
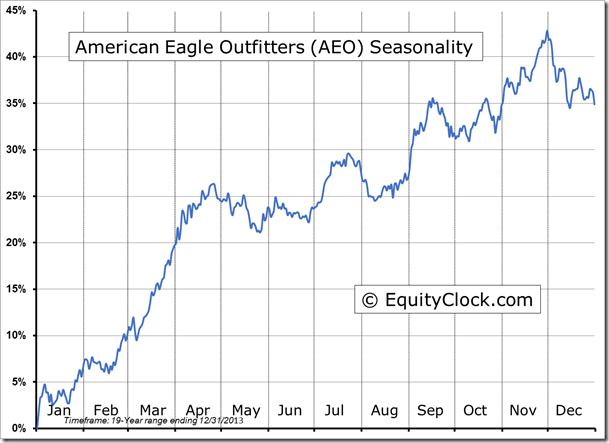
American Eagle Outfitters Inc (NYSE:AEO)
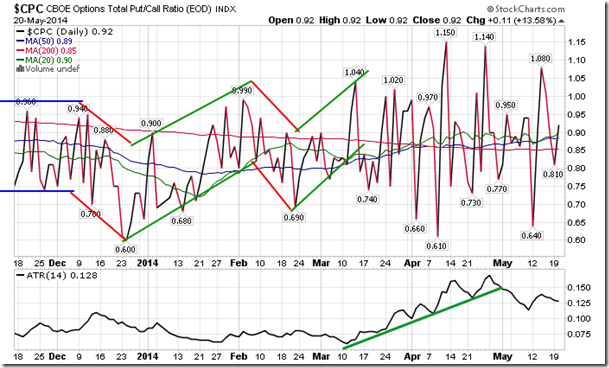
Sentiment on Tuesday, as gauged by the put-call ratio, ended bullish at 0.92.
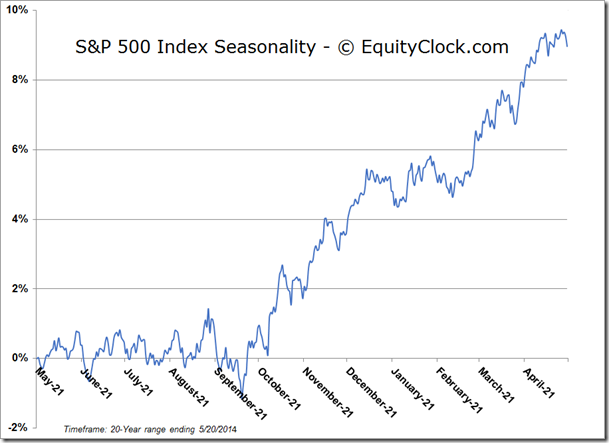
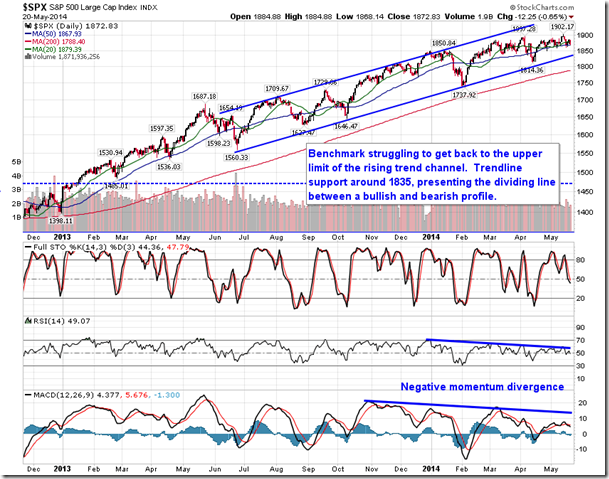
S&P 500 Index
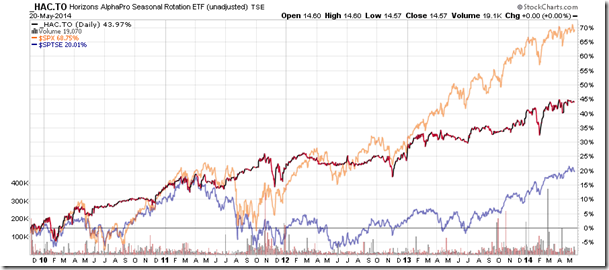
Horizons Seasonal Rotation ETF (TO:HAC)
- Closing Market Value: $14.57 (unchanged)
- Closing NAV/Unit: $14.57 (down 0.08%)
Performance*
| 2014 Year-to-Date | Since Inception (Nov 19, 2009) | |
| HAC.TO | 1.89% | 45.7% |
* performance calculated on Closing NAV/Unit as provided by custodian

