Upcoming US Economic Events for Today:- Durable Goods Orders for April will be released at 8:30am. The market expects a month-over-month decline of 0.8% versus a increase of 2.6% previous.
- FHFA House Price Index for March will be released at 9:00am. The market expects a month-over-month increase of 0.5% versus an increase of 0.6% previous.
- S&P Case-Shiller House Price Index for March will be released at 9:00am. The market expects a year-over-year increase of 11.9% versus an increase of 12.9% previous.
- Flash PMI Services for May will be released at 9:45am. The market expects 55.4 versus 54.2 previous.
- Consumer Confidence for May will be released at 10:00am. The market expects 83.0 versus 82.3 previous.
- Richmond Fed Manufacturing Index for May will be released at 10:00am. The market expects 9 versus 7 previous.
- Dallas Fed Manufacturing Survey for May will be released at 10:30am. The market expects 9.6 versus 11.7 previous.
Upcoming International Events for Today:
- No significant economic events scheduled
The Markets
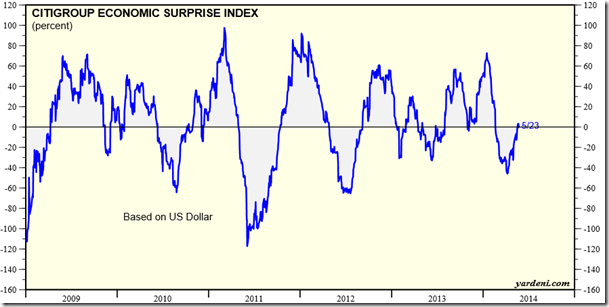
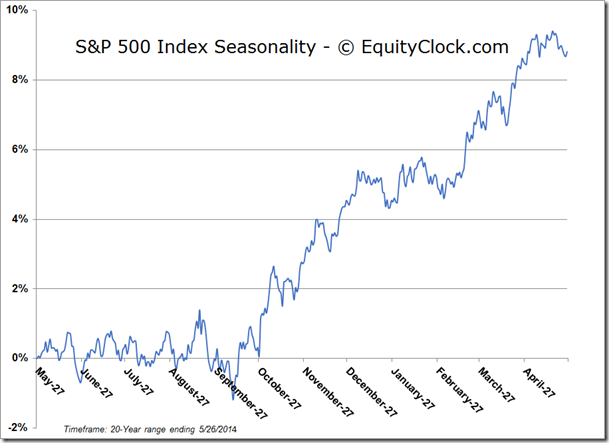
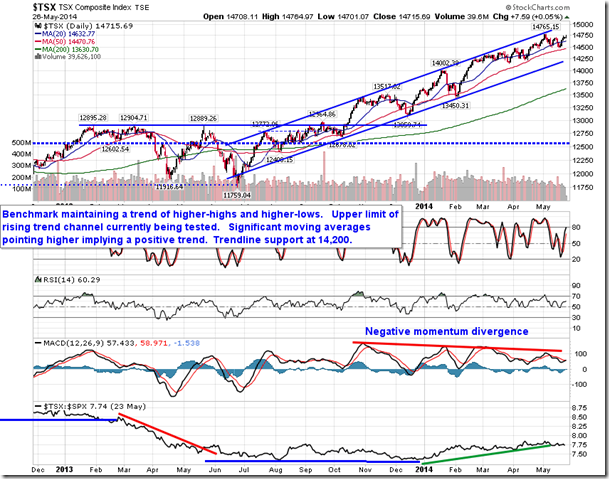
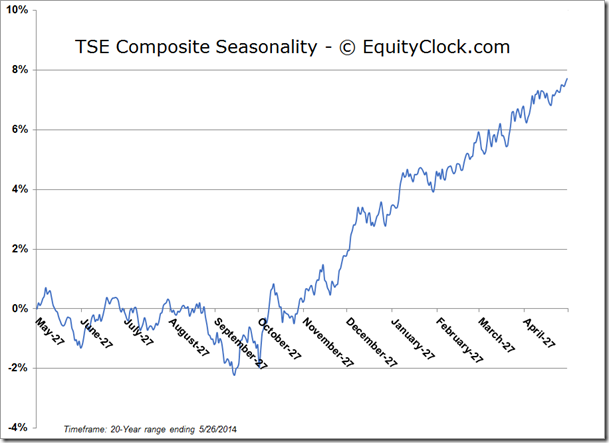
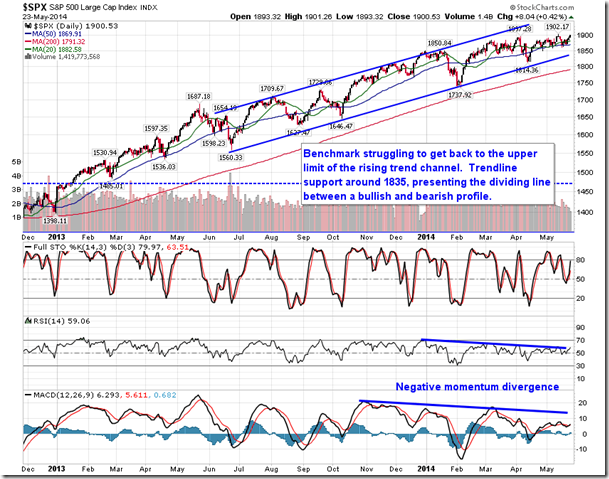
Stocks ended higher on Friday with the S&P 500 Index closing above the physiologically important 1900 level - a level that the market has been bumping up against for the past couple of months. At the time of writing, gains appear to be following through to the new week with S&P 500 futures up nearly one-third of a percent. Gains over the past week have coincided nicely with the positive tendencies surrounding the Memorial Day long weekend. The TSX Composite advanced 1.38% since last Monday, far surpassing the average gain over the past 24 years of 0.45% during the quiet holiday period. Stocks in Canada have been positive 71% of the time leading up to the US holiday as equity prices drift higher amidst lower volumes. The probability for gains returns to more normal levels as traders return to their desk following the Memorial Monday holiday with the tendency for gains during the week ahead ranging anywhere from 50% to 58%, depending on whether you’re looking at US or Canadian benchmarks. The week ahead starts with a number of economic events with everything from house prices to consumer confidence providing further indications of the health of the economy. Recent reports have been beating expectations, providing the strength to power equity benchmarks, such as the S&P 500 Index, to new all-time highs. The Citigroup Economic Surprise Index, a gauge of the degree to which economic reports have been missing or beating expectations, has been pointing higher over the past few weeks, presenting a tailwind for equity prices. The Economic Surprise Index had been pointing lower since the year began, leading many analysts to revise estimates lower to reflect the more subdued activity that remained prevalent through the winter months.
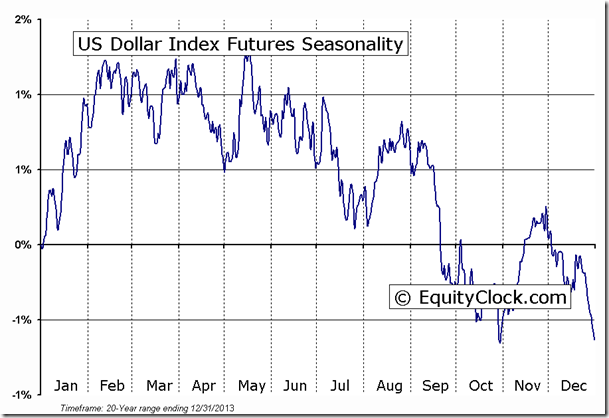
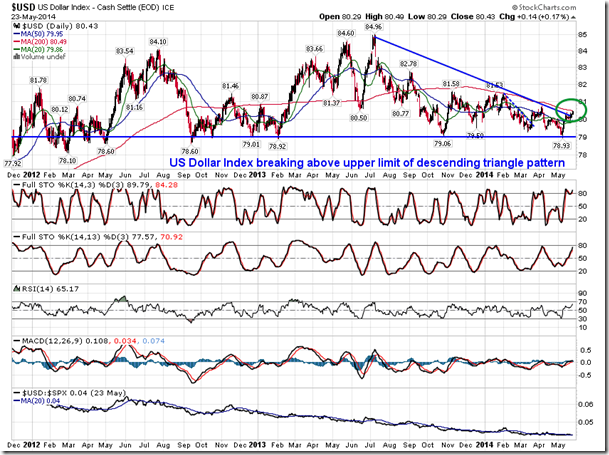
The stronger economic data has also fuelled a breakout in the US Dollar Index, which is showing signs of moving above a descending triangle pattern. Typically a bearish pattern, support around 79 appears to be a significant hurdle preventing a downside move. The currency benchmark is presently bumping up against a downward pointing 200-day moving average, a level that has constrained price activity since last September. Seasonal tendencies for the US Dollar Index are negative between now and the end of October.
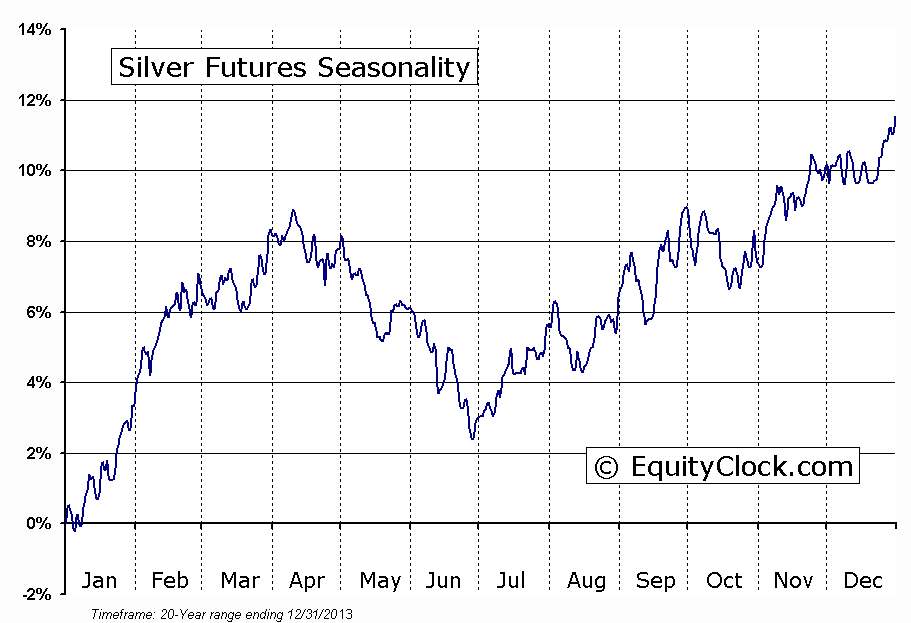
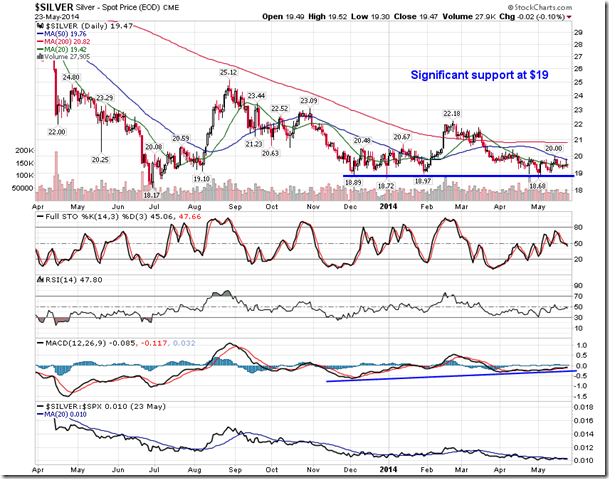
The direction of the US dollar plays a significant role in the strength of commodity prices valued in the American currency. The CRB commodity Index has recently started to underperform the equity market as the strong start to the year for commodities shows signs of unwinding; assets may be rotating bank into equity markets. Mid-April through to late June is the weakest time of year for the broad commodity market as positive tendencies surrounding industrial demand come to an end. One of the commodities that is particularly weak at this time of year is Silver, which declines close to 7%, on average, between mid-April and the end of June. June is seasonally the weakest month of the year for the white metal, declining 65% of the time for an average loss of 3.1%.The metal has been hovering around support at $19. A stronger US Dollar may be the catalyst to crack the significant level of support. Weakness over the next month or so allows for appealing buying opportunities for the period of seasonal strength for both Gold and Silver, which runs from the end of June through to October.
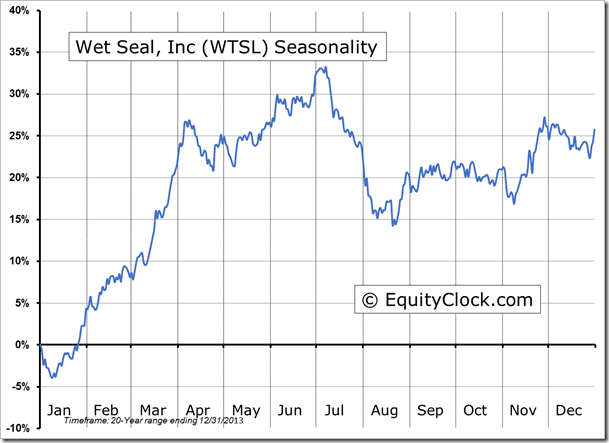
Seasonal charts of companies reporting earnings today:
Wet Seal Inc (NASDAQ:WTSL)
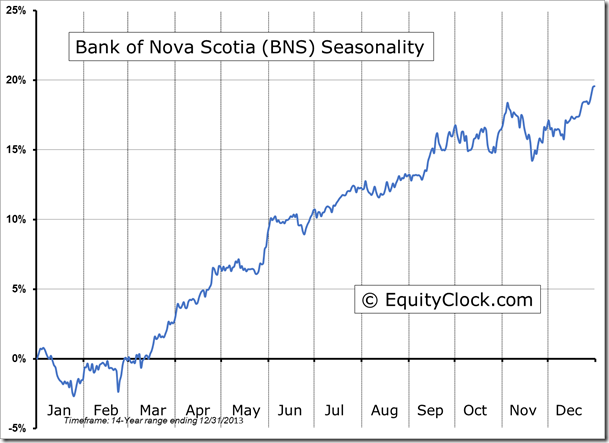
Bank of Nova Scotia (NYSE:BNS)
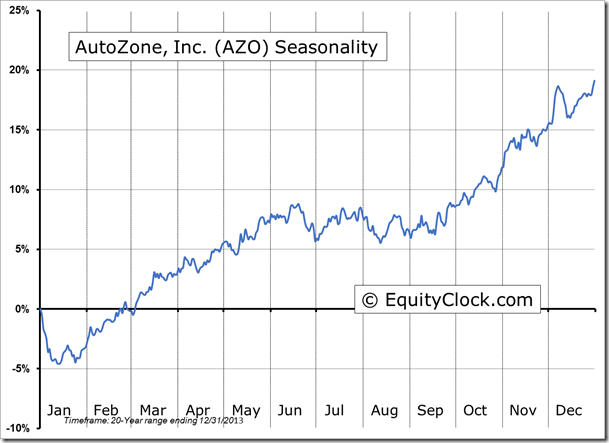
AutoZone Inc (NYSE:AZO)
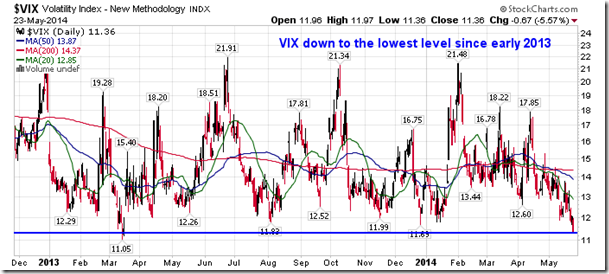
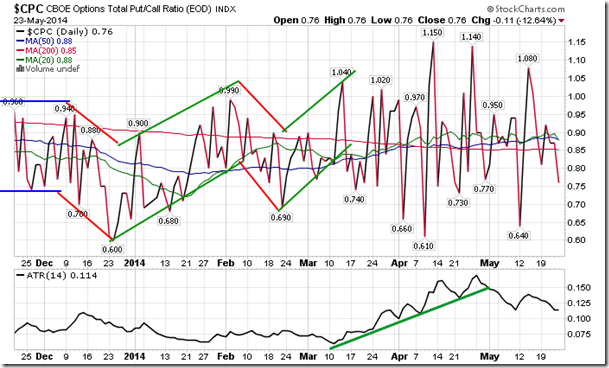
Sentiment on Friday, as gauged by the put-call ratio, ended bullish at 0.76. With investors letting down their guard and leaning more towards upside call options, rather than protective puts, the risk of equity market declines, at least for the short-term, is elevated. Also, the VIX has declined to the lowest level since early 2013, indicating that put option protection is relatively cheap as portfolio hedges fall out of demand. Complacency can be assumed.
S&P 500 Index
TSE Composite
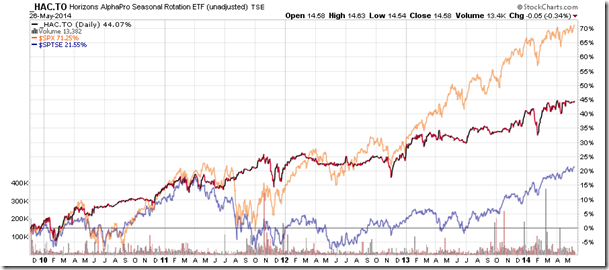
Horizons Seasonal Rotation ETF (TO:HAC)
- Closing Market Value: $14.58 (down 0.34%)
- Closing NAV/Unit: $14.63 (up 0.14%)
Performance*
| 2014 Year-to-Date | Since Inception (Nov 19, 2009) | |
| HAC.TO | 2.31% | 46.3% |
* performance calculated on Closing NAV/Unit as provided by custodian
Click Here to learn more about the proprietary, seasonal rotation investment strategy developed by research analysts Don Vialoux, Brooke Thackray, and Jon Vialoux.

