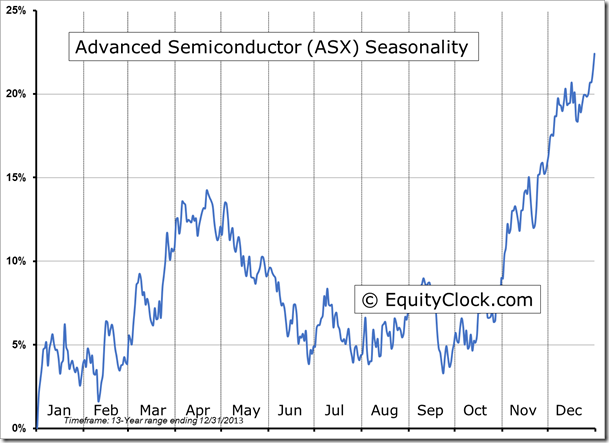
**NEW** As part of the ongoing process to offer new and up-to-date information regarding seasonal and technical investing, we are adding a section to the daily reports that details the stocks that are entering their period of seasonal strength, based on average historical start dates. Stocks highlighted are for information purposes only and should not be considered as advice to purchase or to sell mentioned securities. As always, the use of technical and fundamental analysis is encouraged in order to fine tune entry and exit points to average seasonal trends.
Stocks Entering Period of Seasonal Strength Today:
- No stocks identified for October 30th
The Markets
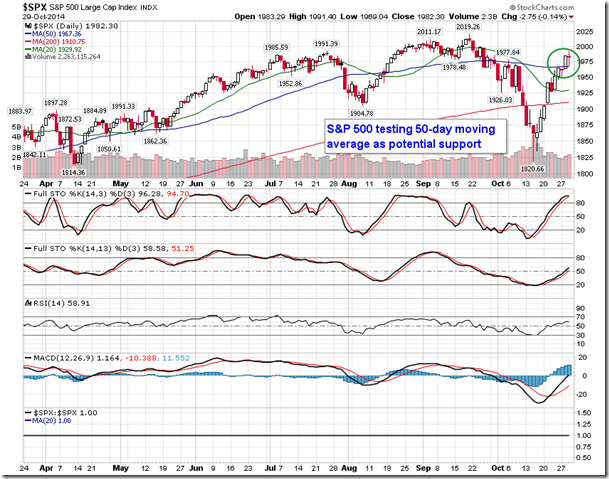
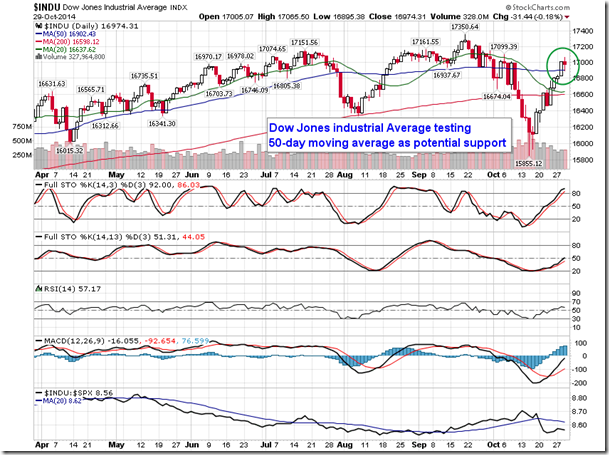
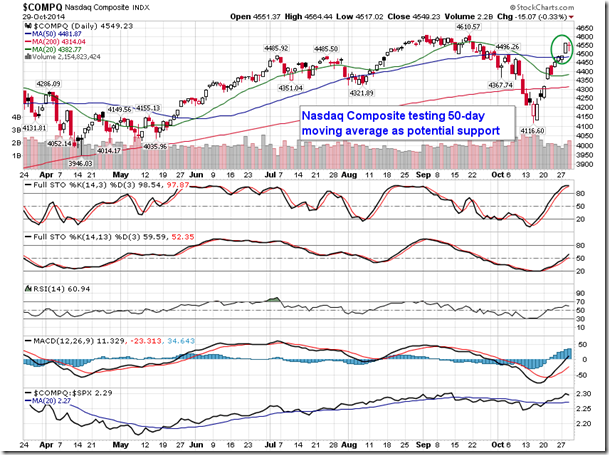
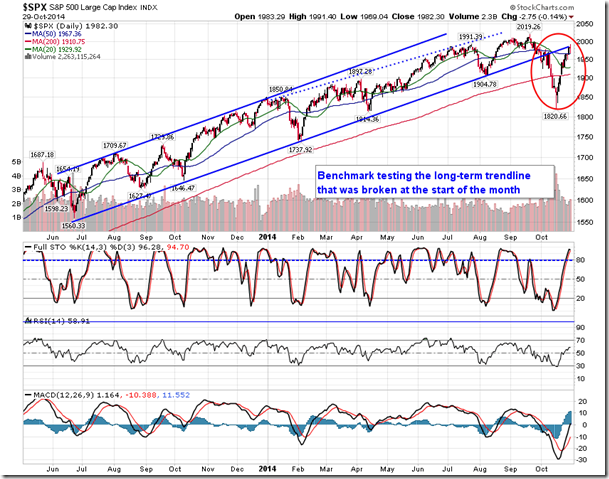
Stocks held around the flatline on Wednesday as investors showed a rather muted reaction to the FOMC announcement, which confirmed the conclusion to QE3. The Fed reiterated that it would hold its benchmark rate near zero for an extended period of time as the committee allows the market to gain a footing prior to the tightening process. Equities in the US will now have the opportunity to prove that they can remain supported based upon fundamentals alone, rather than the trillions of dollars worth of asset purchases that has created the motto “Don’t fight the Fed.” Following the statement release, the S&P 500 Index, Nasdaq Composite, and Dow Jones Industrial Average traded lower to test yesterday’s breakout level at the 50-day moving average, a level that is now implied to become support. The full extent of the reaction to the hawkish Fed statement may not be realized for another couple of days as investors mull the implications of the conclusion of quantitative easing in the midst of a still struggling global economy.
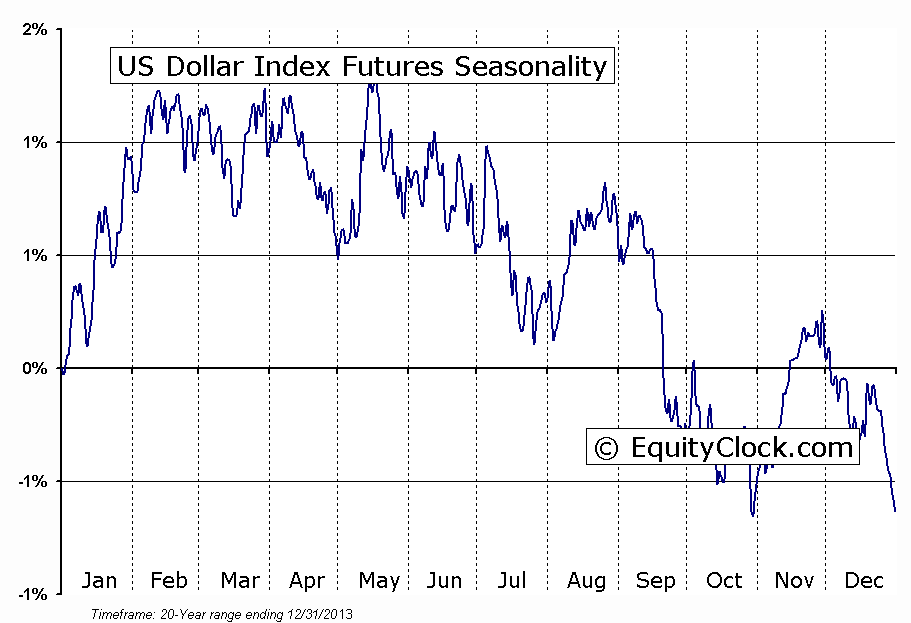
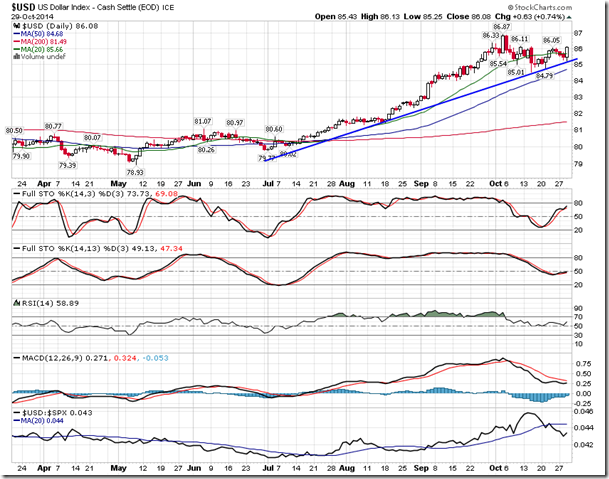
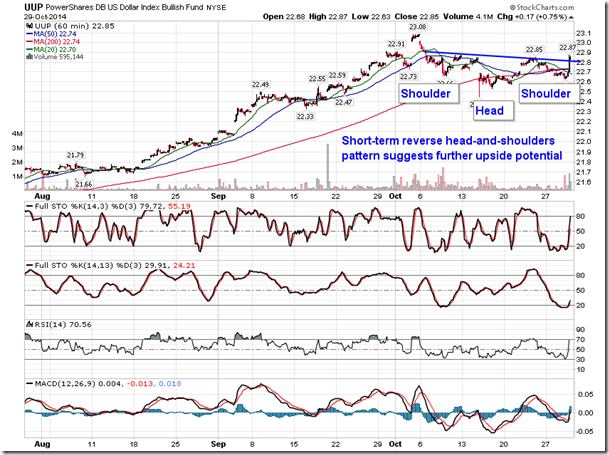
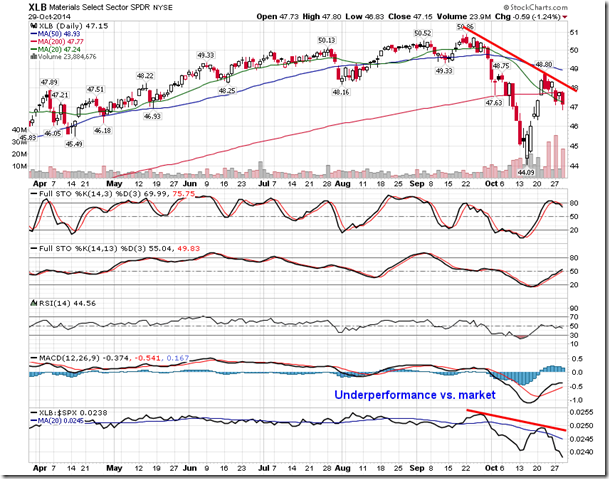
Although reaction in the equity market may have been muted, reaction in the currency market was obvious. The US Dollar Index jumped by three-quarters of one percent, reaching back towards the highs charted earlier this month. A short-term reverse head-and-shoulder pattern is apparent on the chart of the US Dollar Index ETF (PowerShares db USD Index Bullish (NYSE:UUP)), suggesting further upside potential and the resumption of the positive trend that began in July. Although the gains in the currency over the past few months have not been typical, the currency index is now entering into a period when gains are the norm. The month of November tends to be one of the strongest months of the year for the currency on a frequency basis with gains realized in 65% of periods over the past 20 years. Average gain for the 11th month of the year is 0.6%, followed only by January as the second strongest monthly performance during the year. Corporations will tend to repatriate foreign profits back into the domestic currency both before and after the close of the year, leading to increased demand to buy dollars. Commodity and commodity sensitive equities are most at risk given the near parabolic rise in the US Dollar Index since the start of the last quarter; the materials sector was by far the weakest performer during Wednesday’s session, declining by 1.24% and maintaining a sharp trend of underperformance.
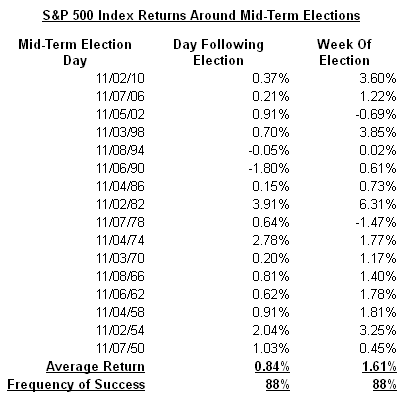
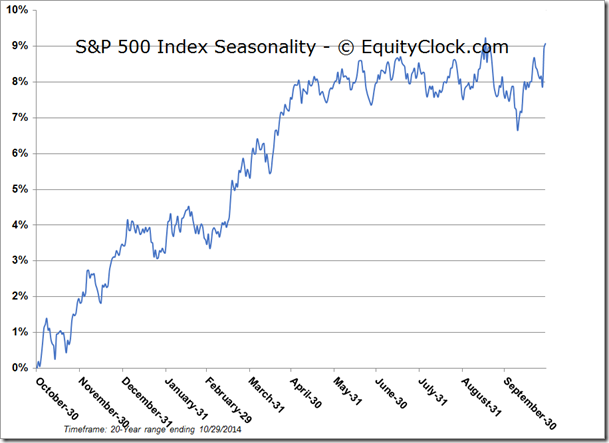
With the FOMC Announcement now behind us, investors will be looking towards the next major market moving catalyst, which looks to be the mid-term elections next week. As of present, the consensus is that the Republicans will gain control of the Senate, alleviating a bottleneck that has been holding back progress in passing legislation, potentially a bullish scenario for equity markets. Historically, the week of mid-term elections has been bullish for stocks with the S&P 500 Index averaging a gain of 1.61% since 1950. Gains were recorded in 88% of the periods as investors reacted positively to the election results. Best day of the election week was the session immediately following the election result; gains averaged 0.84% with a similar frequency of success of 88%. Gains of this magnitude would be enough to propel many of the major equity benchmarks in the US above resistance of the September highs, which would clear the way to new highs through the end of the year. A breakout above the previous high for a number of benchmarks, including the S&P 500, remains a requirement to confirm the conclusion to the recently formed negative trend that was derived following a break of the multi-year positive trendline at the end of last month.
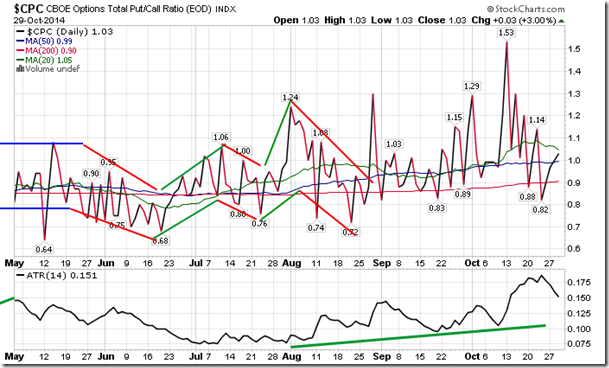
Sentiment on Wednesday, as gauged by the put-call ratio, ended bearish at 1.03.
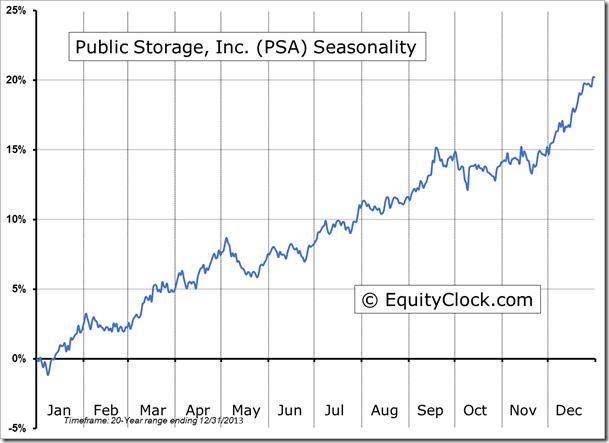
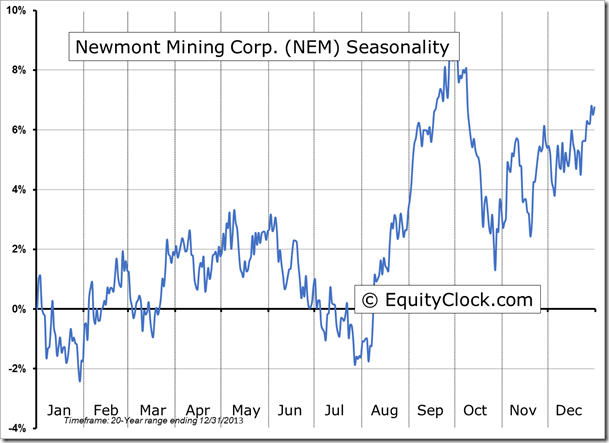
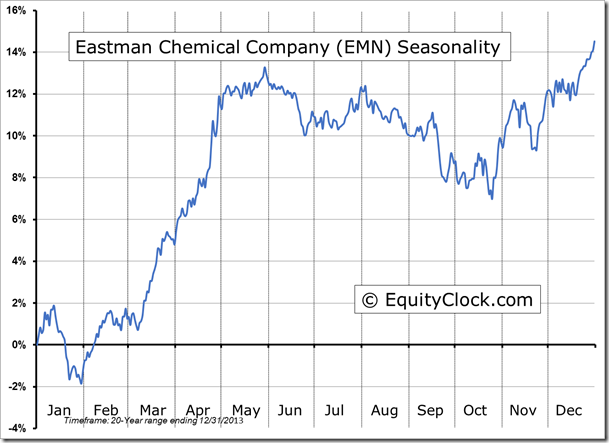
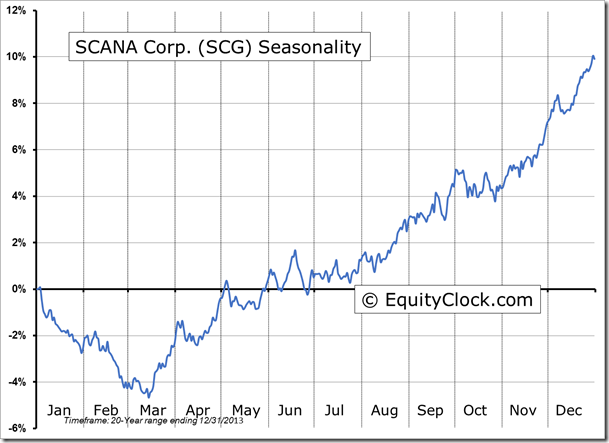
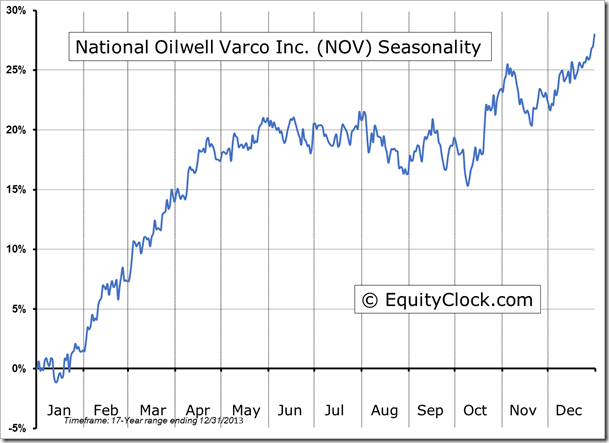
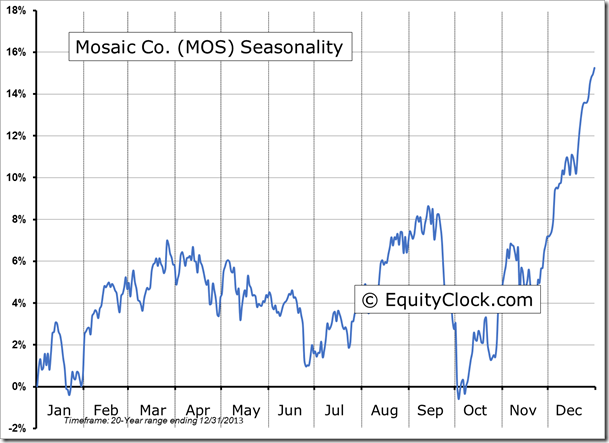
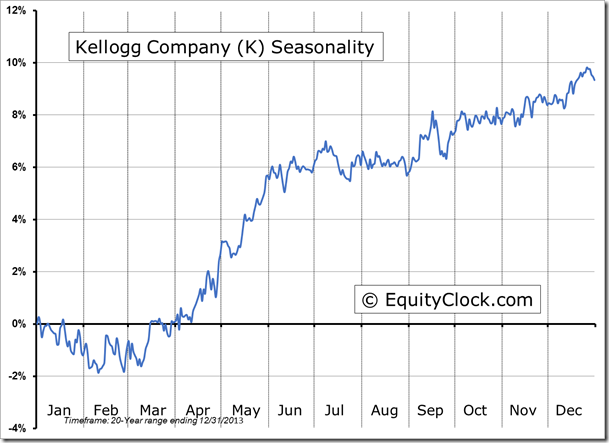
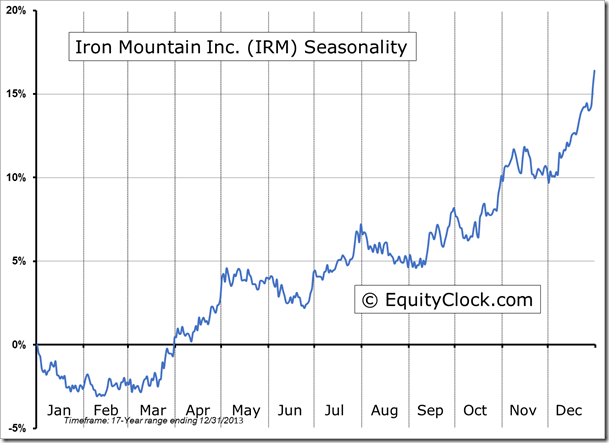
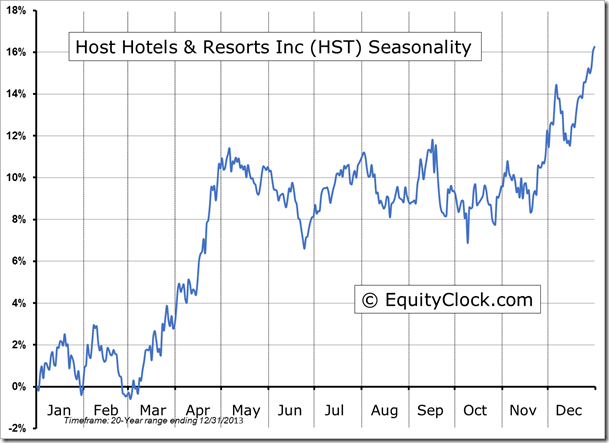
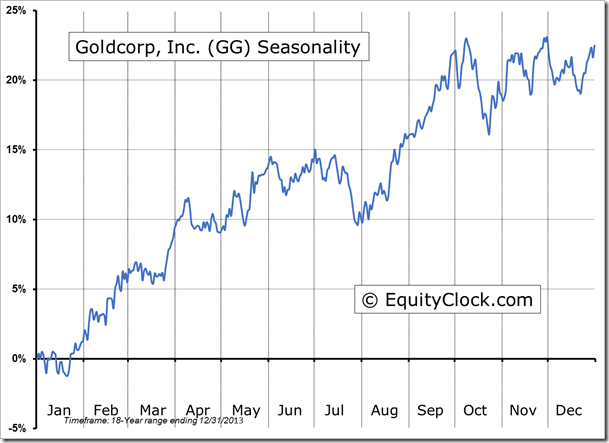
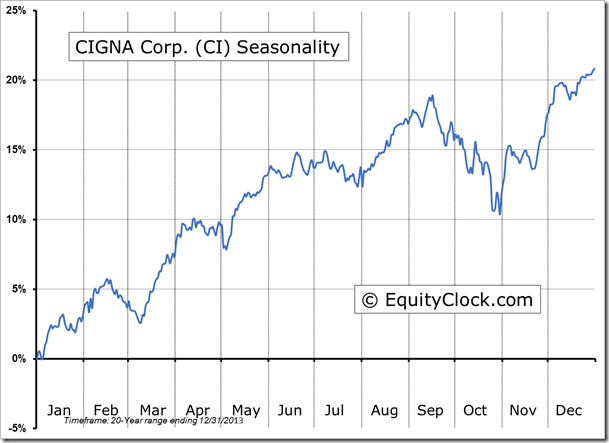
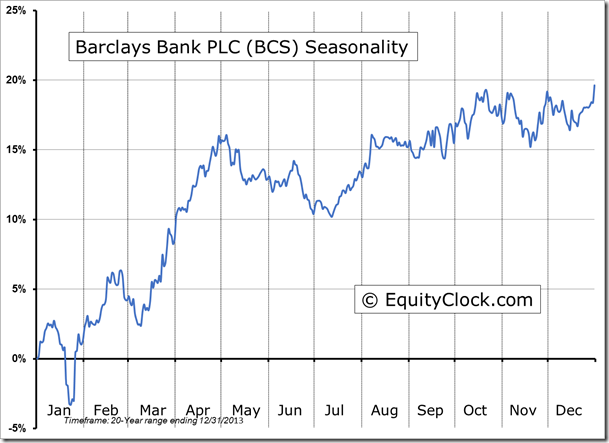
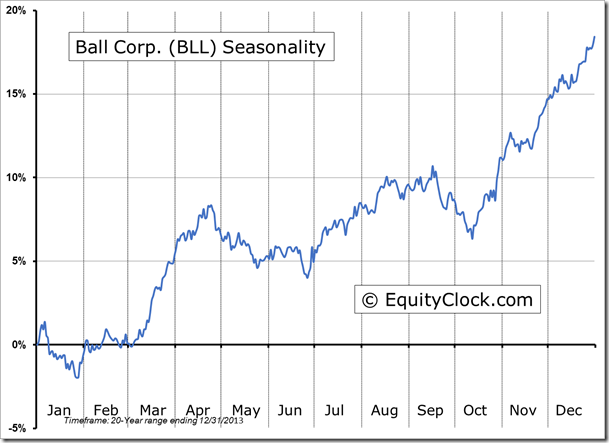
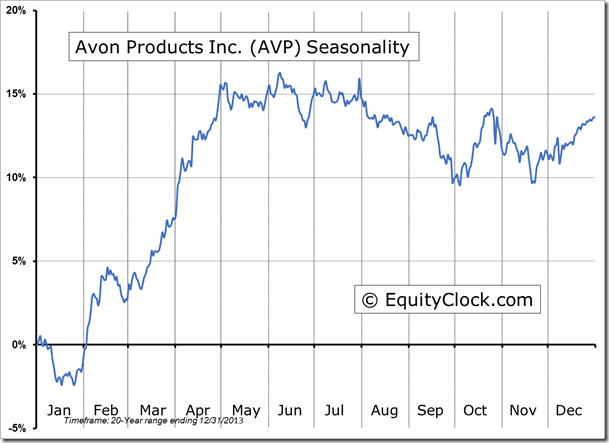
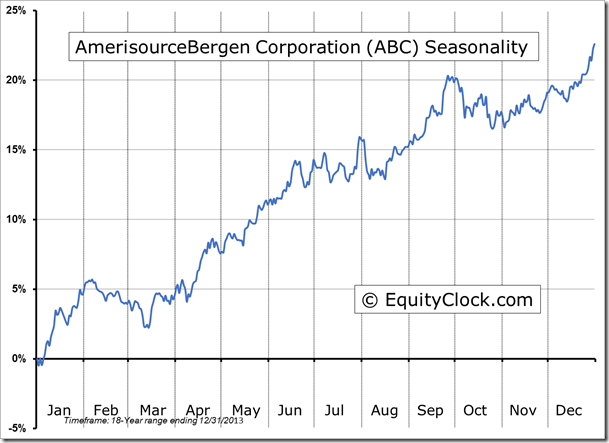
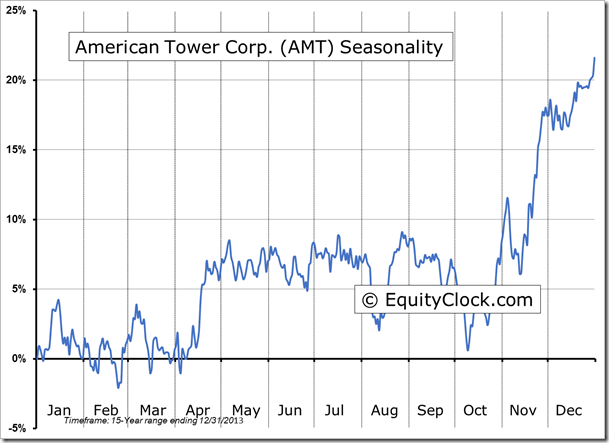
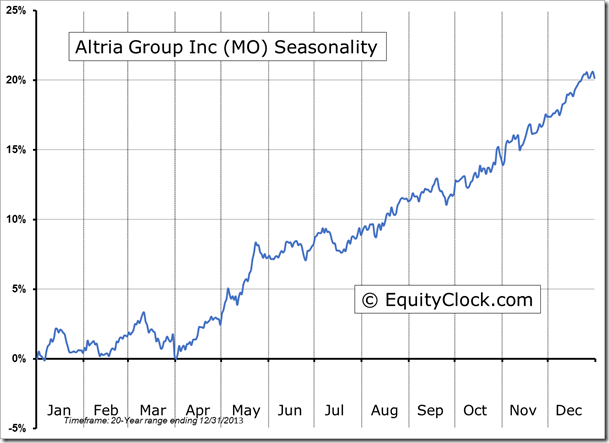
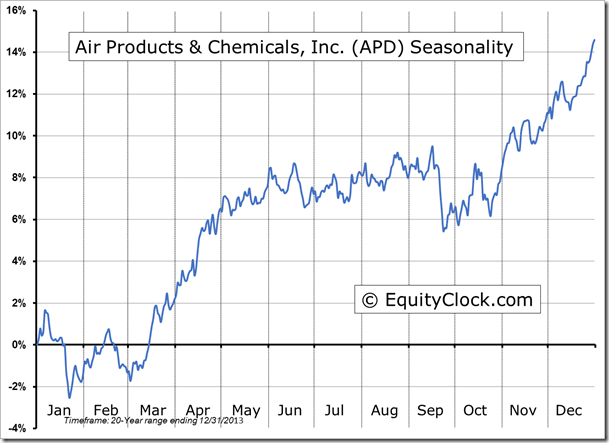
Seasonal charts of companies reporting earnings today:
S&P 500 Index
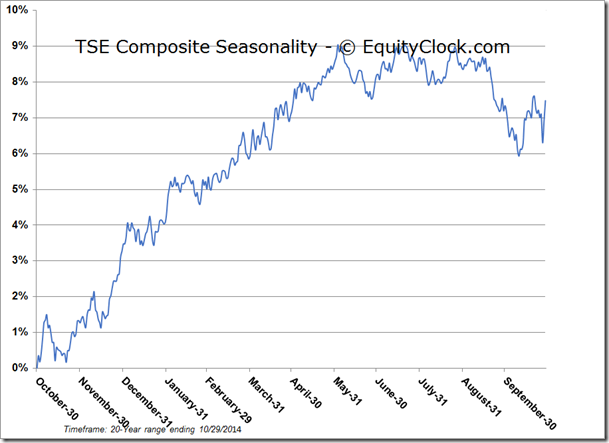
TSE Composite
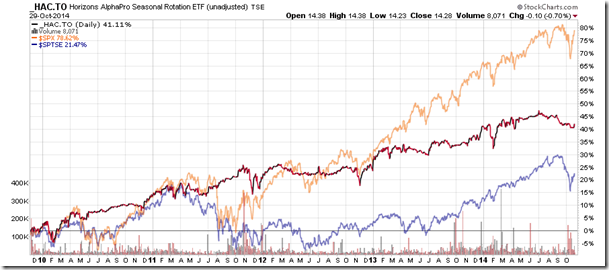
Horizons Seasonal Rotation ETF (TO:HAC)
- Closing Market Value: $14.28 (down 0.70%)
- Closing NAV/Unit: $14.32 (down 0.42%)
Performance*
| 2014 Year-to-Date | Since Inception (Nov 19, 2009) | |
| HAC.TO | 0.14% | 43.2% |
* performance calculated on Closing NAV/Unit as provided by custodian
