Upcoming US Events for Today:- International Trade for March will be released at 8:30am. The market expects a deficit of $40.5B versus a deficit of $42.3B previous.
Upcoming International Events for Today:
- German PMI Services for April will be released at 3:55am EST. The market expects 55.0 versus 53.0 previous.
- Euro-Zone PMI Services for April will be released at 4:00am EST. The market expects 53.1 versus 52.2 previous.
- Great Britain PMI Services for April will be released at 4:30am EST. The market expects 57.6, consistent with the previous report.
- Euro-Zone Retail Sales for March will be released at 5:00am EST. The market expects a year-over-year increase of 1.4% versus an increase of 0.8% previous.
- Canadian Ivey PMI for April will be released at 10:00am EST. The market expects 54.5 versus 55.2 previous.
- Japan Services PMI for April will be released at 7:15pm EST.
- China PMI Services for April will be released at 9:45pm EST.
The Markets
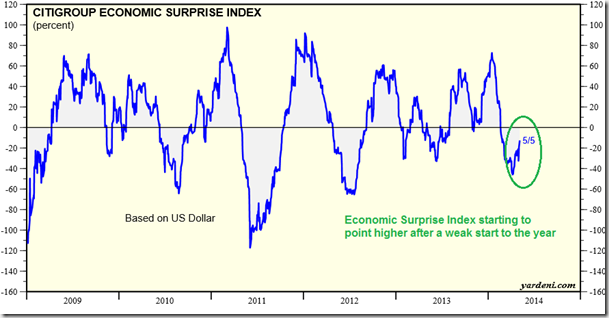
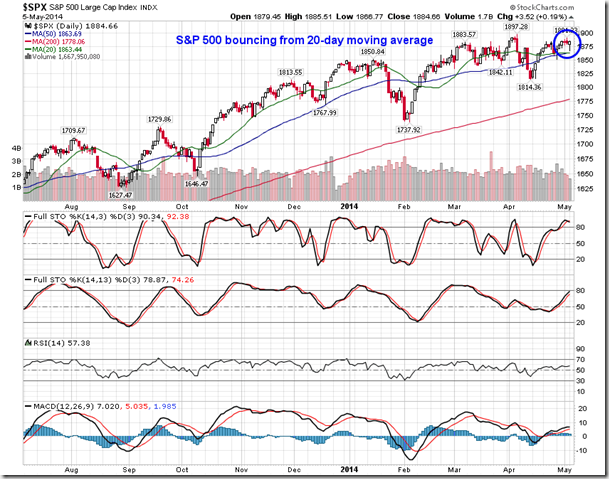
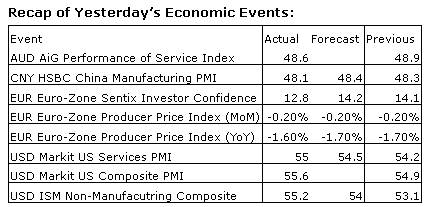
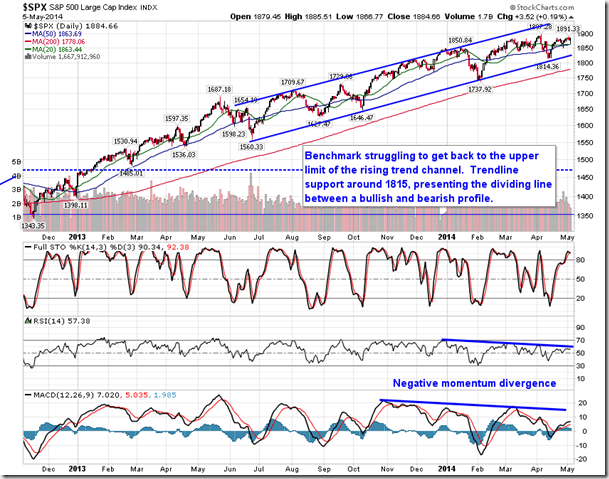
Stocks closed marginally higher on Monday, lifted from their lows by a better than expected read on the Services sector in the US. The ISM Non-Manufacturing Index ticked higher to 55.2 in April, exceeding estimates calling for 54. Readings above 50 indicate expansion. Slowly a trend of economic beats are becoming realized following what has been a disappointing start to the year, dominated by economic misses. The Citigroup Economic Surprise is showing signs of turning higher, rebounding from the lows of the year. The upbeat economic report provided support to the equity market, which opened with pronounced losses as investors continue to become uneasy with the situation between Ukraine and Russia. The S&P 500 Index, Dow Jones Industrials Average, and NASDAQ Composite all bounced from around 20-day moving average lines, recouping the minor losses recorded on Friday. The S&P 500 Index and Dow Jones Industrial Average continue to maintain resistance at 1885 and 16,600, respectively.
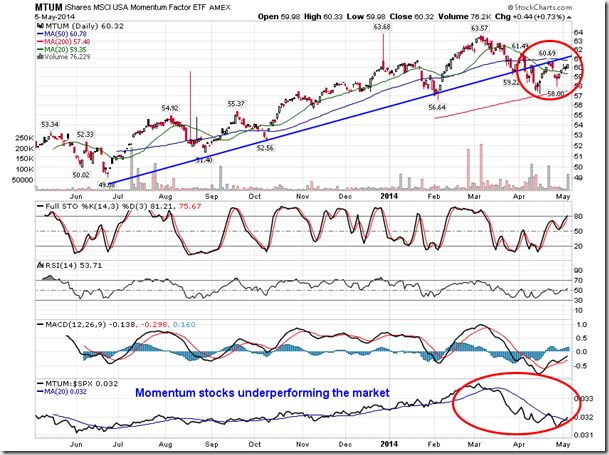
Helping to support the broad market were shares of momentum stocks that had previously been beaten down since the start of March. The momentum ETF (MTUM) is butting up against the previously broken rising trendline as a push-and-pull trading pattern flushes out weak long and short positions. The 20- and 50-day moving averages continue to point lower, implying negative short and intermediate trends. The weakening trends of many momentum stocks continues to pose a risk to the broad market during the summer months as investors typically rotate away from these high-beta, volatility-prone trades.
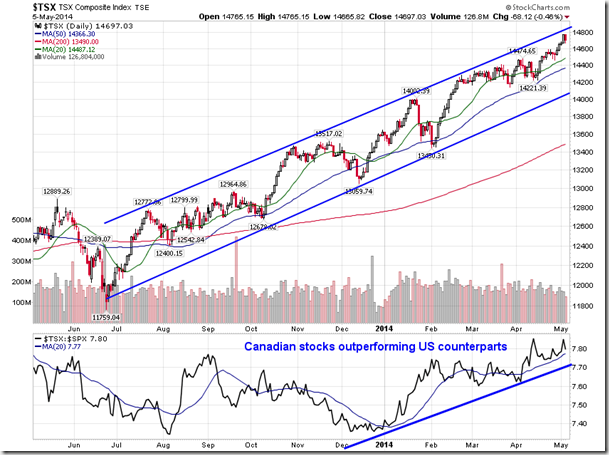
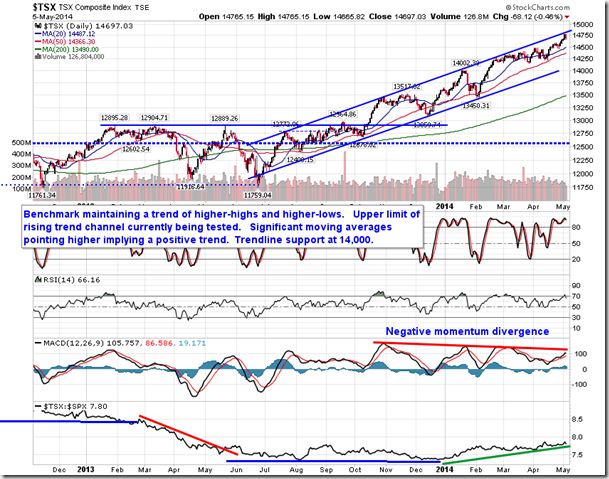
While horizontal resistance for a number of US benchmarks remains obvious, the TSX Composite is battling with a level of resistance of its own. The Canadian benchmark is testing the upper limit of its rising trend channel, pulling back from this level during Monday’s session. Major moving averages, including the 20, 50, and 200-day continue to point higher, implying positive trends across multiple timescales. The benchmark remains on a trend of outperformance versus US counterparts as investors continue to demand Canadian financial and energy stocks; material stocks have also recently captured investor attention.
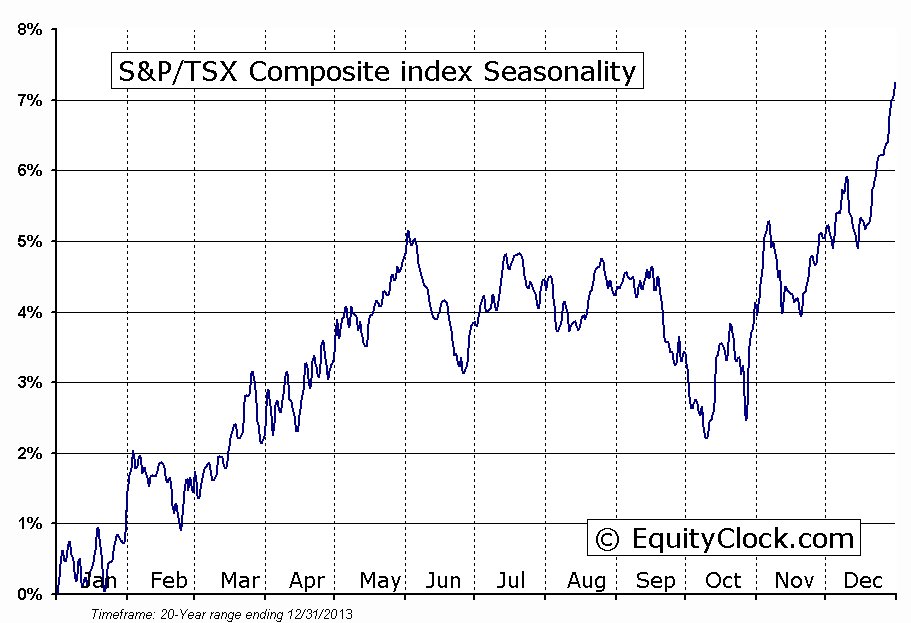
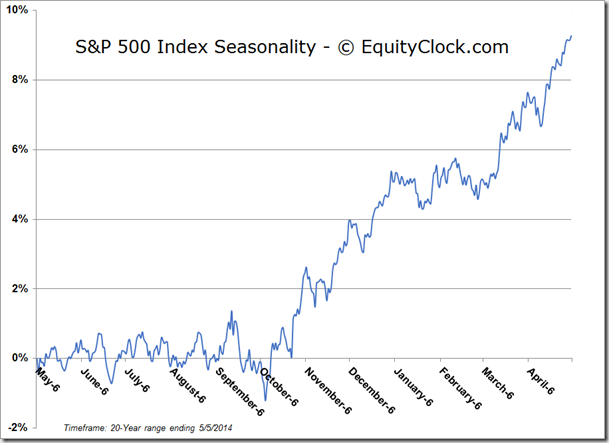
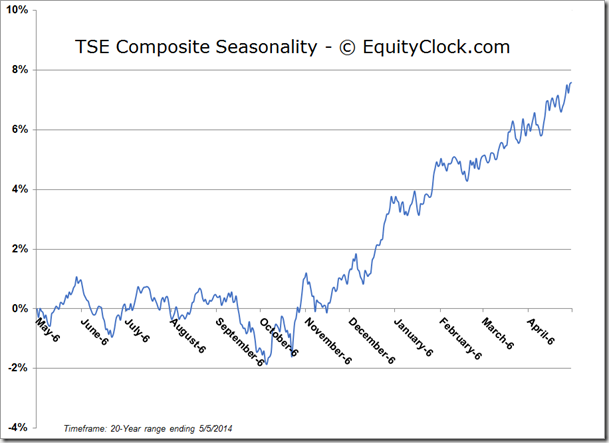
Yesterday, we reported that May 5th was the average seasonal peak to the six-month favourable trend for the equity market. However, the Canadian market can often peak into the month of June, on average, rather than May. Over the past 20 years, May has been the second strongest month for the TSX Composite, outperforming the S&P 500 by around 1.0%. In many instances, the TSX has shown stronger seasonal tendencies than the US market. Over the past 30 years, a portfolio of $10,000 that invested in the TSX Composite benchmark on October 28th and sold on June 2nd would now be worth $154,359 as of the end of April of this year. Conversely, a $10,000 portfolio that bought the benchmark each year over the past 30 years on June 2nd and sold on October 28th would now be worth $4,096. Recall that investments in the S&P 500 during the unfavourable period for stocks between May 5th and October 28th yielded a flat result; the unfavourable season for stocks in Canada tends to result in significant drawdowns, in part due to the significant impact that the materials sector, the weakest market segment during the summer months, has on the Canadian benchmark. Seasonal strength in the TSX Composite through the month of May, beyond the average May 5th date, can be attributed to differences in the timing of earnings report releases in Canada versus the US and differences of the timing of holidays during the month between Canada and the US. For Canadian investors, the positive seasonal trend for stocks may not be over, just yet.
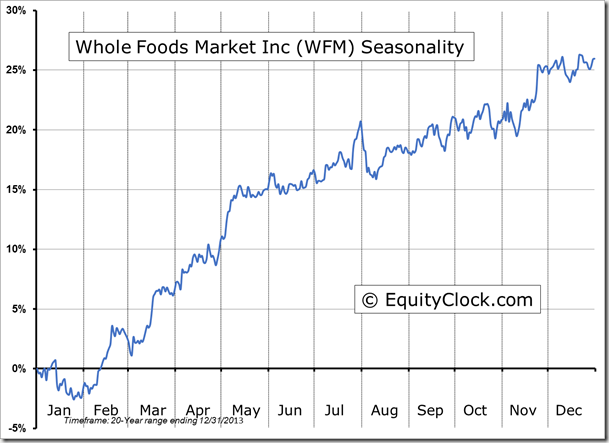
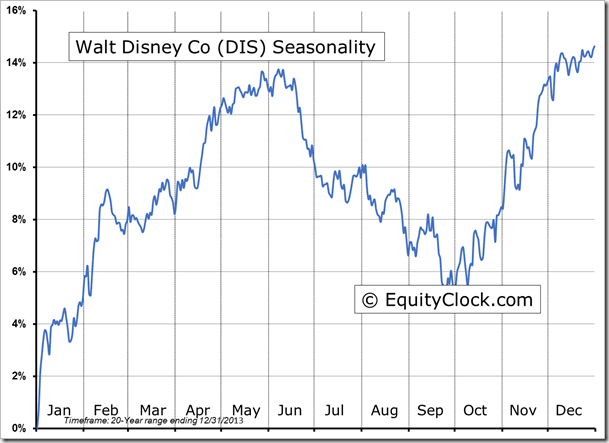
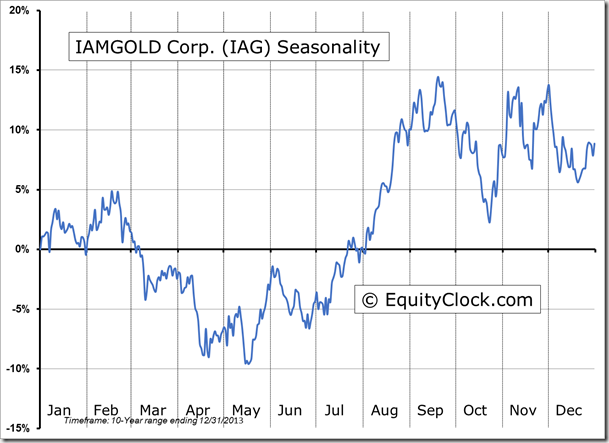
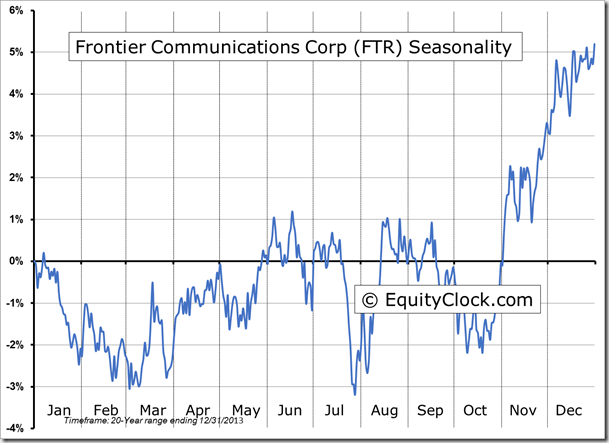
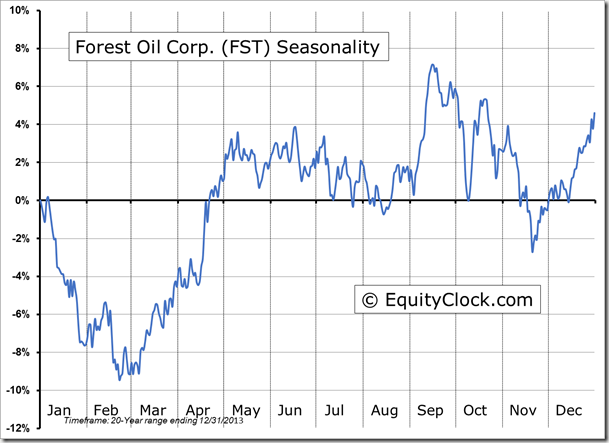
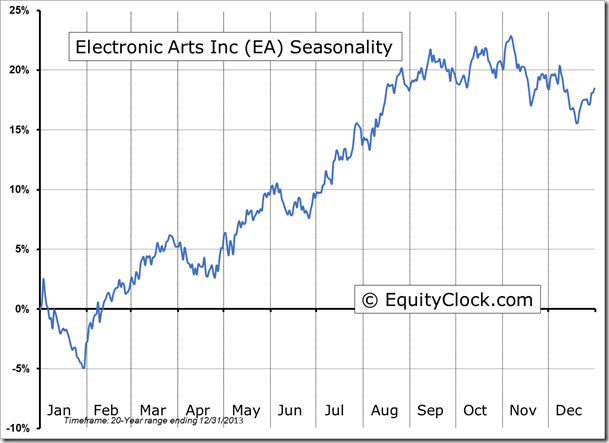
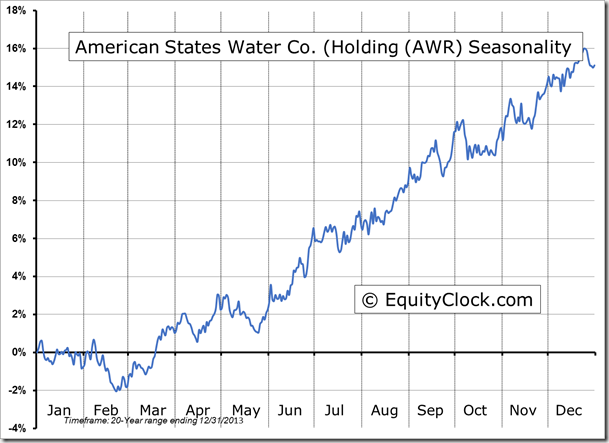
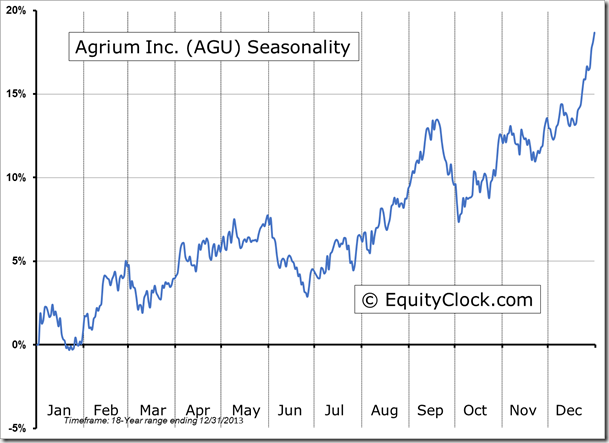
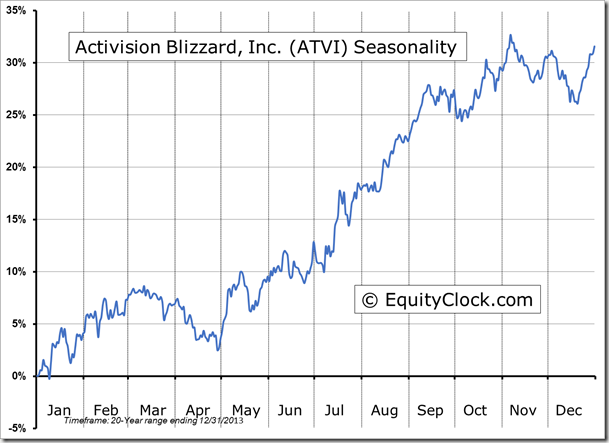
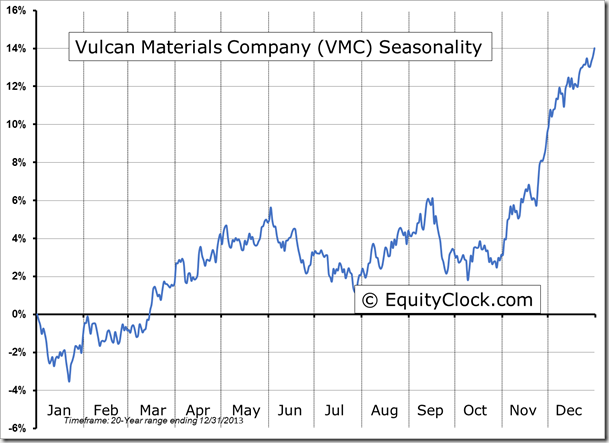
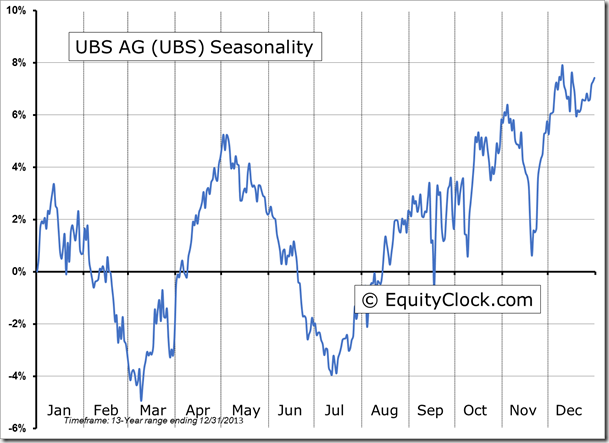
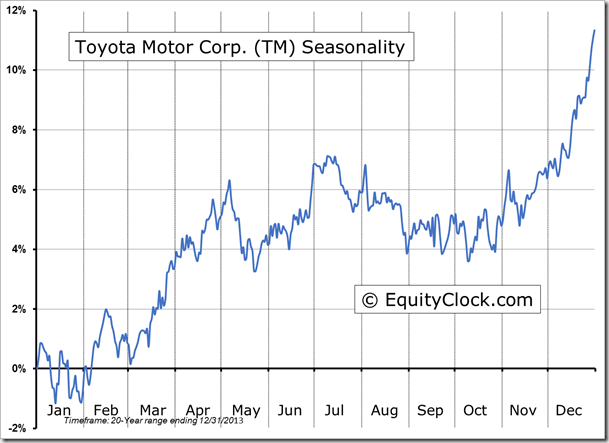
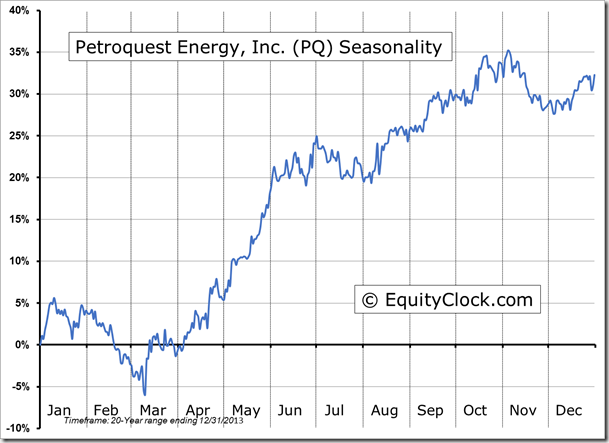
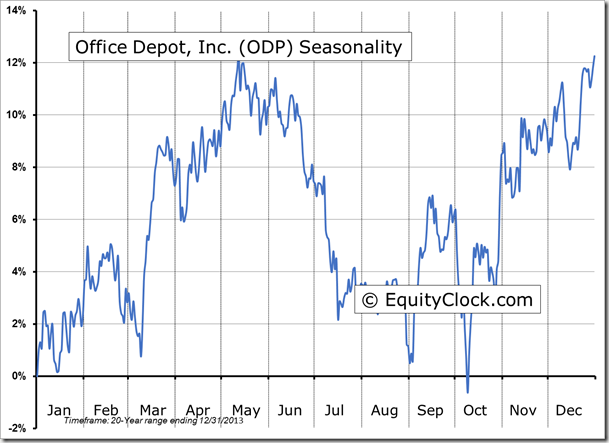
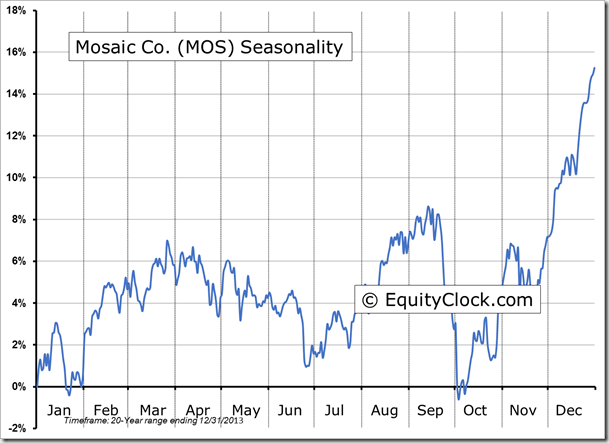
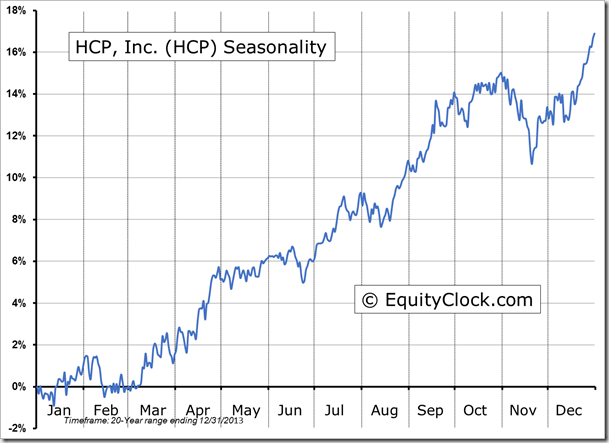
Seasonal charts of companies reporting earnings today:
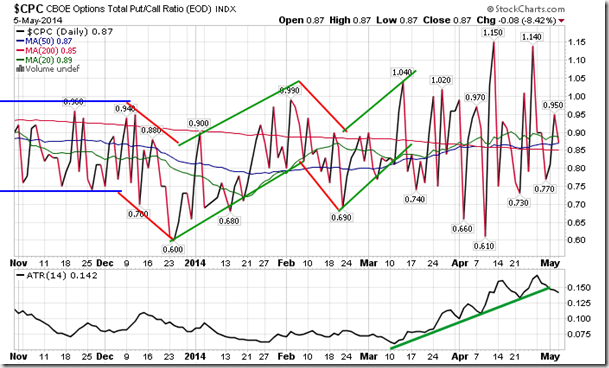
Sentiment on Monday, as gauged by the put-call ratio, ended bullish at 0.87.
S&P 500 Index
TSE Composite
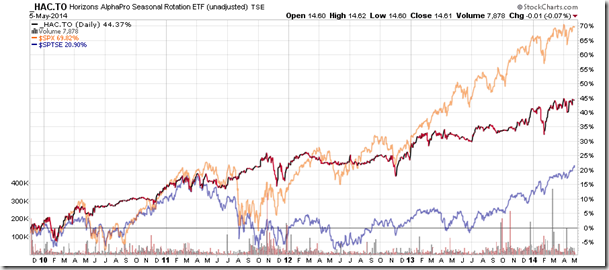
Horizons Seasonal Rotation (TO:HAC) ETF
- Closing Market Value: $14.61 (down 0.07%)
- Closing NAV/Unit: $14.62 (up 0.05%)
Performance*
| 2014 Year-to-Date | Since Inception (Nov 19, 2009) | |
| HAC.TO | 2.24% | 46.2% |
* performance calculated on Closing NAV/Unit as provided by custodian

