The noise in the Brexit saga is deafening, but by all accounts, we are closer on a customs arrangement on Northern Ireland, yet, still have to work on the issue of VAT. It is unclear at this stage if there will be any concrete proposal to thrash out in tonight’s EU Council meeting, but the political will seems to be there, with both France and Germany saying a deal could be forged within a day at the EU Summit. Donald Tusk going as far as saying a deal is ready, but there are “certain doubts on the British side”.
The market remains fixated on the math in the UK parliamentary and whether any deal achieves the 320 votes needed to pass. That is going to be tight by all accounts, and political commentators are doing the numbers, and it seems the probability is Johnson will garner close to 300, but fall short of 320 - But it's not impossible, but there is still more twists in this painful drama.
The market continues to reduce Brexit hedges, and GBP shorts continue to cover as we head into the EU Summit and the UK Commons Saturday session (9 am GMT/6 PM AEDT), which puts gapping risk firmly in play. GBP/USD has pushed into 1.2877 and the highest levels since May, although it has pulled back a touch into 1.2826, with 1-week implied volatility dropping a touch to 17.91% (from 18.88%). The big GBP move has come against the NOK and to a lesser extent NZD, with GBP/NOK and GBP/NZD gaining +0.9% and 0.4% respectively. GBP/NOK has pushed into the highest levels since June 2016, although the NOK is weak across the board.
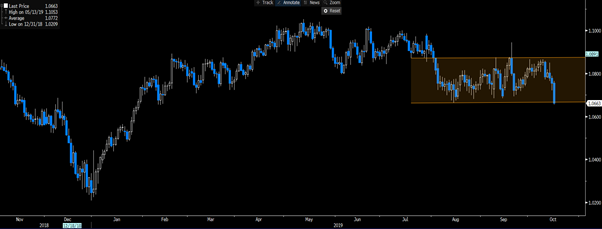
EUR/NOK has taken out the 2008 highs and pushed to the highest levels on record, while NOK/SEK (see below) has to be on the radar with price testing the low of the 1.0650 to 1.0900 range its traded since early August. A closing break of 1.0664 and I am a seller with conviction.

EUR/GBP looks interesting with the buyers stepping in at the figure (0.8600), and the daily candle shows not just punchy 118-pip range, but indecision in the price action. After a sizable move lower of late, it feels EUR/GBP are going to cover here.
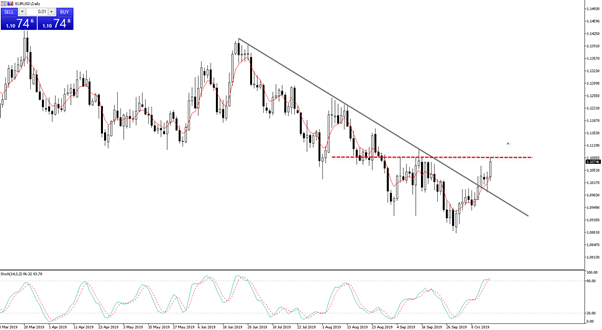
Outside of Brexit, the USD index is a 0.3% lower on the day, with the USD falling modestly against the CHF, EUR, SEK, and GBP. EUR/USD has put on 0.4% and remains the dominant driver of the USD index, which has struggled a touch on the poor US retail sales report, which fell 0.3% relative to expectations of a gain of 0.3% as well as an uncompelling Beige book. On the daily we see EUR/USD breaking its series of lower highs from June and into supply at 1.1085 – a nice looking chart, but it needs more work to suggest a bullish trend plays out. EUR buyers would have taken heart with reports Merkel’s CDU party is “preparing a stimulus package if GDP falls further”.
(Daily of EUR/USD)

USD/JPY has gone nowhere taking its direction from the S&P 500 Futures.
The retail control group element (the group of goods that feeds into the GDP calculation) was unchanged versus expectations of 0.3%, and that may see a few sell-side investment banks GDP tracking estimates lowered a touch. The result has been a bid in the rate market, with fed fund futures pricing an 84% chance we see a 25bp cut from the Fed at the 30 October FOMC meeting, with 61bp of cuts priced over the coming 12 months.
This has also seen a bid in the bond market, with UST 2s -3bp to 1.58% and a reasonably punchy 5bp drop in 5yr ‘real’ (i.e. inflation-adjusted) Treasury’s. Gold rallied, as a consequence, and sits up 0.6% at $1490.
In the equity world, flip to the German DAX, which has moved the highest levels since August 2018 – long DAX/short S&P500 looks compelling. US equities have closed out the session modestly lower, with the S&P 500 -0.2% at 2991 and the NASDAQ 100 -0.3%. Breadth has not given us too much, with 55% of stocks lower on the day (in the S&P 500), on volumes 5% below the 30-day average. Bank of America (NYSE:BAC) stole the limelight on earnings, and the market liked what they saw, with the stock putting on 1.5%, although the tape wasn’t overly impressive, closing on its lows. IBM (NYSE:IBM) reported in the after-market, which is more of a consideration for Dow (Wall Street) traders, given its 3.5% weight on the index. The numbers don’t look great (relative to expectations), and the stock is 4% lower, with Q3 revenue at $18.03b vs the consensus of $18.22b and EPS of $2.68 vs $2.67.
Aussie SPI futures were trading at 6717 at 16:100aedt and having closed at 6704 we see a softer open for the local market after yesterday’s impressive 1.3% rally. The focus moves to the Aussie jobs data, so, in a soft equity market, we turn to the AUD and rates market where consensus sits at 15,000 net jobs created and the unemployment rate to say at 5.3%. With the RBA gunning for “full employment,” another move higher in the unemployment rate, even if it is driven by a higher participation rate will see the implied probability of a November cut move from 42% towards 50%.
