Still looking for reasons to get Long this week?
While I am busily looking for incremental data in which to point you towards, it was a tough week to get more excited. The yuan devaluation again highlighted the Chinese government’s desire to boost its economy at the expense of other nations; though you could also say that if China continues to slow down, the whole world will grind to a halt. The U.S. Equity markets began to meltdown on Wednesday until U.S. corporations helped rescue it with very aggressive stock repurchases. Crude oil prices continued to make new low prices all week, with each pullback adding fuel to the bond bulls who see deflation and a chance that the FOMC will look to December instead of September for the first rate increase.
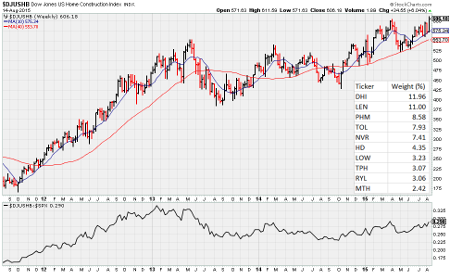
So what was positive about the week? Well, the VIX closed closer to 12 than to 16, which was its high for the week, and even with fixed income catching a bid, Financial stocks did not break and the NYSE:XLF held above its 50-day moving average. And then there were the Housing stocks, which gave you another reason to look into the names (see chart below). But at the end of the week, I didn’t feel any better about putting more money into the market than I did the week prior. It is still August, and news, data, and volumes are slow. Time is best spent working on individual names or resting ahead of the September news flow that will be generated from all the conferences and pre-announcements.
Now about that breakout in housing stocks…
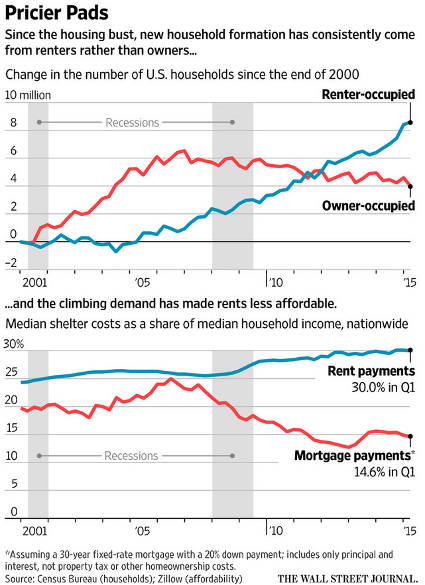
Lower oil caused a drop in Interest Rates, which helps Mortgage affordability, but the surge in apartment rents is also providing an umbrella for the builders to create new product…
The cost of renting a home is rising faster than wages across wide swaths of the country, a problem that has become especially acute in the past year, putting a big squeeze on many household budgets. The situation is particularly noticeable in long, pricey areas across the West and in big cities like New York, where the average household pays more than 40% of its gross income for rent, according to online real-estate database Zillow (NASDAQ:Z). But rising prices also have spilled over into cities like Denver, Atlanta and Nashville. Much of the problem is attributable to simple supply and demand. The job market has improved and millennials are entering the labor pool in force, boosting household formation. But in a structural shift for the real-estate market, new households are much more likely to be renters than buyers
This sharp move lower in crude oil directly benefits Treasury Bonds (for both the deflationary and lower growth implications), but it negatively impacts Junk Bonds for the economic impact to corporations impacted by the hit to lower Energy activities.
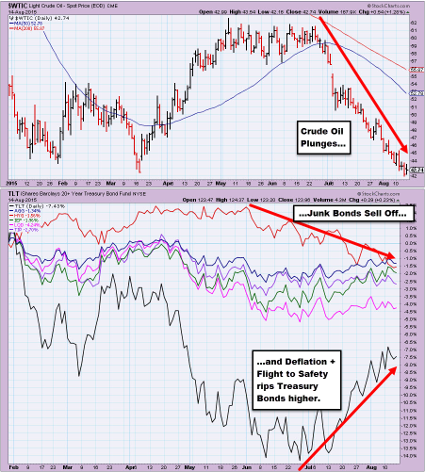
Crude prices have continued to fall at an alarming rate, as the commodity is caught up in a perfect storm of negative news flow. The IEA released an update this week saying that current supplies are growing at a “breakneck speed,” helped by recovering Middle East sources and continued Saudi and North American production. And in the U.S., West Texas Crude pricing got punched by the BP (LONDON:BP) Whiting refinery shutdown…
On Wednesday, BP acknowledged that the largest of Whiting’s three crude units, which processes about 240,000 barrels a day, had been down since Saturday for unscheduled repair work. The refinery draws heavy crude from Canada as well as Cushing, Oklahoma, the tank hub that is also the delivery point for the WTI futures contract. Market speculation suggests it could be out for more than a month, possibly more than two. Reuters reported on Thursday afternoon that leaks had been found in piping at the plant, citing people familiar with the refinery’s operations. Traders said that could be a complex fix for the company. Andy Lipow, president of Lipow Oil Associates consultancy, said: “The bottom line is that every day the Whiting crude unit is down adds 240,000 b/d of supply into the midcontinent market … That unwanted crude is going to build inventories in Canada as well as the midcontinent. Some of it is going to be placed in storage in Cushing.”
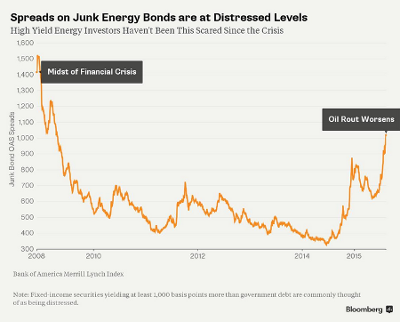
As the Energy data points continue to be negative, the liquid capital markets are shutting down for the average Energy company, which could be good news for the private equity and debt players in the illiquid space…
The rout in energy-company debt has all but shut off capital markets to the weakest companies, leading to an increase in defaults. The trailing 12-month default rate on speculative-grade energy debt may reach 4 percent in August, more than double the historic average of 1.9 percent, Fitch Ratings said in a statement Thursday.
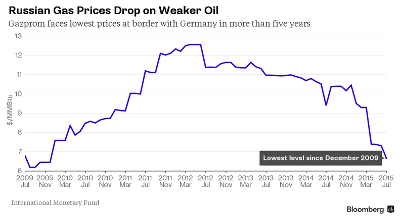
Lower prices, while bad for Russia, will be a boom for German manufacturers…
Russia boosted natural gas supplies to Germany by almost 50 percent in the second quarter as prices plunged, while the world’s largest natural gas exporter struggled with weaker demand from its former Soviet allies. Gazprom (MCX:GAZP) PJSC’s deliveries to Germany jumped to 11.7 billion cubic meters compared with 7.8 billion a year earlier, the highest quarterly level since at least 2010, according to data on the Moscow-based exporter’s website. Gazprom’s average gas price at the German border fell 36 percent this year as crude plunged. The European Union, which gets about 30 percent of its gas from Russia, may be Gazprom’s only growing market this year, the government in Moscow said last month. Gazprom has boosted fuel sales to the 28-nation bloc since the end of May as Brent crude slumped 21 percent.
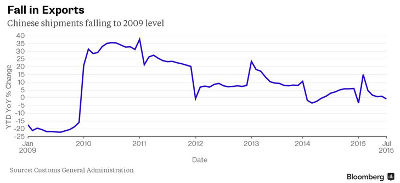
Big story of the week was the Chinese yuan devaluation. Why they did it should be no surprise… They wanted to fire up their own internal growth rate, which is export driven, and a higher U.S. dollar will hurt commodity prices (thus helping China), while also increasing the return on their vast U.S. Treasury holdings. The only question left is why they didn’t let the yuan float more freely sooner…
Letting the market steer the yuan is the kind of move that should please critics who accuse China of controlling its currency to help exporters at the cost of other nations. The IMF has welcomed the change, though it added it will wait to see how the new mechanism is implemented. The yuan hadn’t budged much since March, as China’s policymakers wanted stability as part of the IMF push. By coincidence or not, the devaluation came days after data showing a big fall in exports. A mix of interest-rate cuts and fiscal stimulus to spur growth has struggled to gain traction. So, by weakening the currency, the thinking is that shipments will get a jump start and rev up the economy
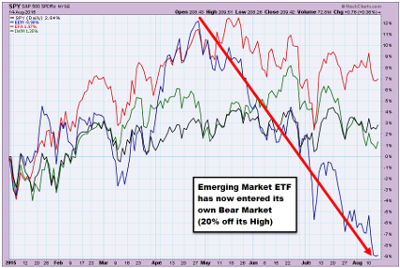
Of course, a more competitive yuan hurts those economies that compete against China for manufacturing. Add to this falling oil prices for any economy dependent on energy production, and you have an explanation for the Bear Market that hit the Emerging Markets (NYSE:EEM) ETF last week…
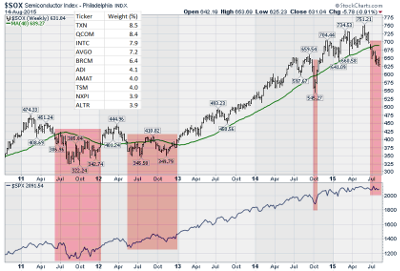
Back in the day, the Semiconductor Indexes used to be closely aligned with the Korean stock market due to Samsung (KS:005930) and other technology influences.
The Korean market is much more diversified today but surprisingly the Semi Index is now >15% off its 2015 highs. More important to note in the chart below is how difficult the S&P 500 performance has been when the Semis have underperformed. So if you need another coincidental metric for your radar screen, add the SOX index or NASDAQ:SOXX ETF.
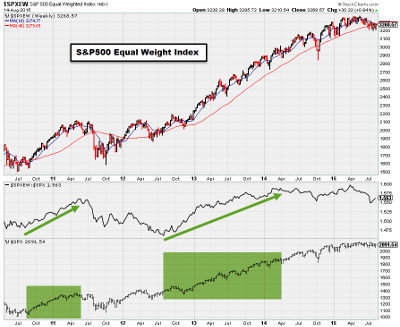
Longs could also get help from the recent change in breadth…
Not only is the Equal Weight S&P 500 underperforming its Market Cap weighted index, but it looks as if its moving averages are starting to collapse on each other. To reiterate again, we like to make money in the major index when the tape is broadening out. This is not rocket science. When the environment is difficult, we want to look to protect capital and avoid being fully invested.
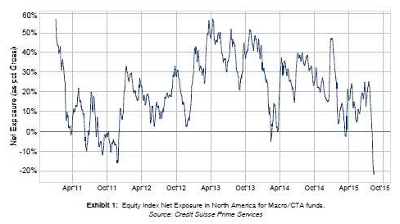
Take a close look at what the aggressive hedge funds (Macro and CTAs) are doing with their U.S. Equities – they aren’t taking added risks right now…
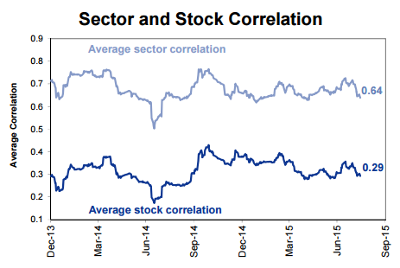
That is not to say you can’t make money in equities right now; if anything, active managers can add more value because of the decline in Sector and Single Stock correlations. Now is a very good time to be a stock picker as long as you are closet indexing your portfolio…
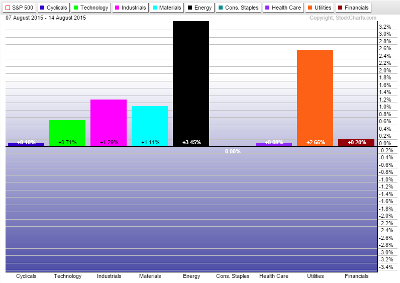
For the week, the Energy sector led even though Energy Commodities fell to new lows, and Utilities gained with the move in Treasuries. But a good week with no sectors in the red (few would have seen that happening at 10am on Wednesday!)
Back to the near meltdown on Wednesday…
Who did the buying as U.S. stocks staged the biggest turnaround in three years? The companies that issued them. The Goldman Sachs Group Inc (NYSE:GS) unit that executes share buybacks for clients had its busiest day since 2011 on Wednesday, according to a note from the firm’s corporate agency desk. Based on the value of equities repurchased, volume handled by the bank set a record. The note was confirmed by spokeswoman Tiffany Galvin. Corporations have emerged as one of the biggest sources of fresh cash in the stock market, eclipsing even mutual funds with more than half a trillion dollars spent last year, according to data compiled by S&P Dow Jones Indices. They swooped in and bought again on Wednesday as the Standard & Poor’s 500 Index flirted with its largest two-day selloff since January.
But beware politicians promising to ban or regulate Corporate buybacks…
Should corporate stock buybacks be regulated? Or made illegal? Those are the questions not-so-quietly being floated in Washington by a group of elected officials and others trying to get elected, including most recently, Hillary Rodham Clinton. Is the government really going to outlaw buybacks, which over the past decade have become one of the business world’s favorite corporate finance tools? On its face, the issue may seem like a nonstarter. But a growing debate has emerged around the topic of buybacks that increasingly has Wall Street and corporate America worried.
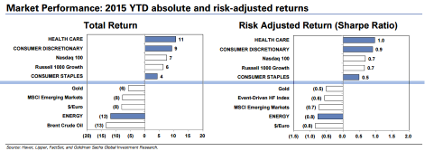
Looking at the top and bottom 5 of Absolute and Risk Adjusted Asset shows identical YTD leaders and nearly the same at the bottom…
Speaking of gold, the dirty, yellow metal gained a big fan last week…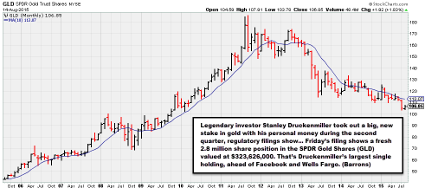
If credit trends are continuing to deteriorate 7 years into an economic recovery, then there is something wrong with the liability. Where do you think delinquencies and write-offs will go when there is another economic slowdown? This is not sustainable.
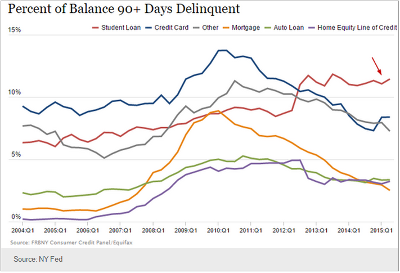
In another sector of U.S. consumer credit, student loan delinquencies have been on the rise. The delinquency rate is now materially above other forms of credit. Part of the reason of course is that this financing is provided by the government, with limited focus on the borrowers’ ability to repay. It’s a vicious circle – cheap and easy credit from the government creates ample demand for higher education (including at many really expensive schools), encouraging schools to raise tuition and fees, which in turn requires larger student loan amounts per student. Thus we have a rising delinquency rate. The taxpayer exposure to this asset class continues to grow.
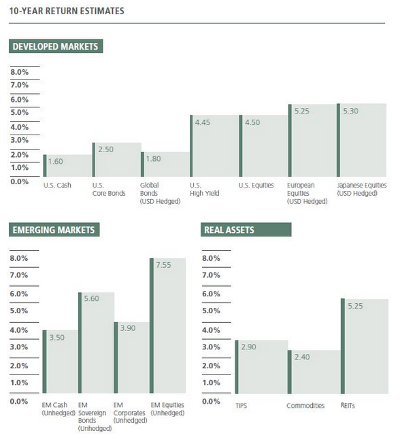
PIMCO just released their Asset Allocation framework for their updated New Normal outlook. To the disappointment of every State and City Pension plan, there is only one marketable asset class with a 10-year return estimate > 6%…
DoubleLine is looking to buy an Equity manager. A bet on higher interest rates or just a move to diversify?
Jeffrey Gundlach’s DoubleLine Capital is bidding to buy San Francisco-based fund manager RS Investments, in a move that would build the firm’s equity offerings, two sources told Reuters on Friday. DoubleLine and Cleveland-based Victory Capital are among a handful of bidders for RS Investments, in a deal that could be valued up to $275 million, said the sources, both of whom wished to remain anonymous because the sales process is confidential. Guardian Life Insurance Company of America, the parent of RS Investments, tapped Morgan Stanley (NYSE:MS) in June to find a buyer for the business, which has $20 billion in assets under management. Second round bids for RS Investments were due Friday.
Schwab specific insight into their Mutual Fund and ETF flows shows how difficult it is to be in the Mutual Fund business these days…
Look at net inflows by Schwab customers into mutual funds and ETFs by month over the past year. (These numbers are all in millions of dollars.) Charles Schwab (NYSE:SCHW) is a firm that leads the market in no-load mutual funds. It earned $839 million last year from its lucrative Mutual Fund OneSource program. And yet, ETFs outpolled mutual funds for net inflows 130-to-1 last year among its customers. We have seen this story before. Over the past six years, ETFs have pulled in more than $1 trillion in net inflows while mutual funds haven’t managed to attract $200 million. But going 130-for-1 over a 12-month period at Charles Schwab is extraordinary.

The information presented here is for informational purposes only, and this document is not to be construed as an offer to sell, or the solicitation of an offer to buy, securities. Some investments are not suitable for all investors, and there can be no assurance that any investment strategy will be successful. The hyperlinks included in this message provide direct access to other Internet resources, including Web sites. While we believe this information to be from reliable sources, 361 Capital is not responsible for the accuracy or content of information contained in these sites. Although we make every effort to ensure these links are accurate, up to date and relevant, we cannot take responsibility for pages maintained by external providers. The views expressed by these external providers on their own Web pages or on external sites they link to are not necessarily those of 361 Capital.
