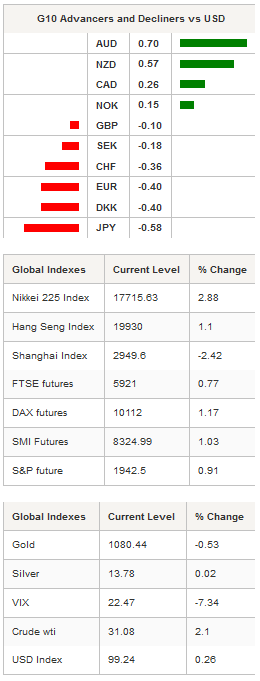
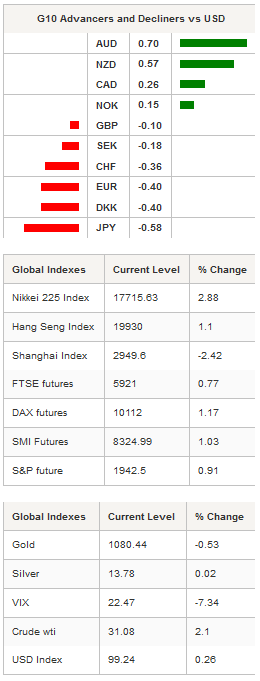
Asian regional equity indices were broadly higher with the exception of China. European stock futures are pointing to a higher open. After an extend period of contraction, China’s December trade data was stronger than expected with exports and imports declining less than anticipated and showing signs of improvement. While the numbers were not outstanding they were encouraging enough to support sentiment. From Japan November industrial machinery orders increased +2.8% y/y to Y309.635 bln. The Nikkei 225 rose 2.88%, Hang Seng 1.73%, while the Shanghai Composite fell another -2.45%. The USD and JPY came under selling pressure as risk appetite returned. Much maligned AUD and NZD lead the G10 leaders higher. In the regional EM currency space KRW, MYR and IDR were the big gainers verses safe haven currencies. USD/CNY fixing virtually unchanged at 6.563. AUD/USD rallied from 0.6980 to 0.7049 as investors unwound extended shorts in the crosses. Solid supply can be seen at 0.7070, which will slow AUD bullish momentum. Also helping the commodity-linked currencies was the slight rise in crude prices from its 12 year low for the first time in 8 days. Brent crude front month is precariously lingering around $31.00 (WTI $30.70 after falling below $30 intraday), yet with legislation to end a 40-year-old ban on exporting U.S. crude coming into effect downside risk are increasing.

China’s trade balance widened more than expected as exports were down -1.4% (-8.0% exp), while imports fell -7.6% (-11.0% exp). Clearly the trade surplus of $60.09bln, is not outstanding but still a positive light in a very dark place.
Interestingly, import volumes of major commodities increased in December on soft prices. Elsewhere, China's December vehicle sales rose 15.4% y/y, passenger vehicles 18.3%. We continue to suspect that weakness in China's equity markets are the consequence of mismanagement of currency policy and regulator slip-ups rather than new signs of deep economic troubles. Equity trading and China economic outlook will start to decouple while expectation for global contagion will fade.
With increased volatility the short end of the US yields curves has steady declined. U.S. 2-Year yields are now lower than the Fed raise inters rates in December. With evidence that two FOMC members (including NY Fed board ) did not vote for a rate hike combined with global markets disruption (Fed’s third mandate) we suspect that the probability of a March rate hike has declined significantly. With the US economic calendar thin this week, the lack of supplementary data supporting the Fed’s gradual path will keep USD weaker. Finally, 4Q15 earnings season unofficially began this week, with expectations very low as EPS is expected to fall 5% and earnings growth to be negative again.
Trade will be watching EU industrial production and US beige book.

Currency Tech
EUR/USD
R 2: 1.1387
R 1: 1.1095
CURRENT: 1.0896
S 1: 1.0458
S 2: 1.0000
GBP/USD
R 2: 1.5529
R 1: 1.5242
CURRENT: 1.4520
S 1: 1.4321
S 2: 1.3657
USD/JPY
R 2: 125.86
R 1: 123.76
CURRENT: 117.30
S 1: 115.57
S 2: 105.23
USD/CHF
R 2: 1.0676
R 1: 1.0328
CURRENT: 0.9976
S 1: 0.9786
S 2: 0.9476
