Last week’s review of the macro market indicators noted heading into the Labor Day shortened week equities were looking stronger led by the QQQ. Elsewhere looked for gold (GLD (NYSE:GLD)) to continue in its uptrend while Crude Oil (USO (NYSE:USO)) sustained a small bounce in the downtrend. The US dollar index (DXY) continued to move down with small bounces while US Treasuries (TLT) were pulling back in their uptrend.
The Shanghai Composite (ASHR) was strong consolidating a break out, ready to continue higher and Emerging Markets (EEM) were rising and making 3 year highs. Volatility (VXX) looked to remain at very low levels keeping the bias higher for the equity index ETF’s SPDR S&P 500 (NYSE:SPY), IWM (NYSE:IWM) and QQQ (NASDAQ:QQQ). Their charts were all recovering with the SPY (NYSE:SPY) gaining short term strength, nearing a trend resumption while the IWM headed higher short term in a rising channel. The QQQ breaking to new all-time highs looked the strongest.
The week played out with gold moving higher while crude oil started higher but then stalled and pulled back. The US dollar continued down to 2 year lows while Treasuries moved higher to 10 month highs. The Shanghai Composite continued to drift higher to 20 month highs while Emerging Markets rose and then held at 3 year highs.
Volatility bounced but held under the teens, keeping the bias higher for equities. The Equity Index ETF’s held in tight ranges on the week, starting higher Tuesday and then leveling with the QQQ the strongest initially but then giving up some gains and SPY and IWM marking time. What does this mean for the coming week? Lets look at some charts.
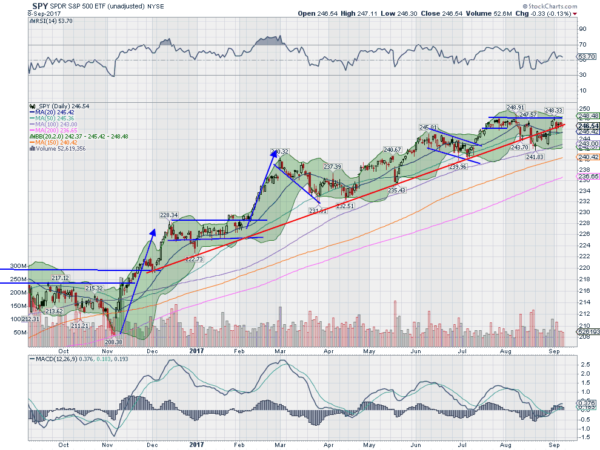
SPY Daily, SPY

The SPY came into the week just 3 pennies below its all-time high from early August. That move at the end of a four day run resulted in a doji candle though and it wasted no time Tuesday confirming it to the downside. But it did not continue, holding a range inside Tuesday’s candle the rest of the week. It ended the week little changed and over all of the SMA’s and the rising trend line. The daily chart shows the RSI is bullish but pulling back while the MACD rising but very slowly.
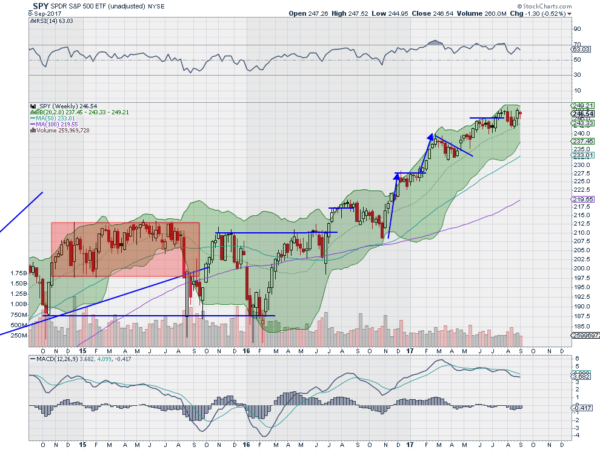
On the weekly chart the inside week or Harami will have some looking for a reversal. That would need confirmation next week with a lower close. But focus on how the price has not moved under the 20 week SMA since rising out of the 2016 pullback. As it spins a range sideways the RSI remains bullish but is retreating while the MACD is also slowly resetting lower. There is resistance above at 248 and then a short term Measured Move to 250. Support lower sits at 246 and 245 then 244 and 242 then 240. Consolidation in the Uptrend.
SPY Weekly, SPY

The joy in the equity markets that was there when the week started faded to just a subtle fist pump at the end of the holiday shortened week. Elsewhere look for gold to continue in its uptrend while crude oil pulls back in its move higher. The US dollar index continues to melt down while US Treasuries are biased to the upside. The Shanghai Composite is pausing in its break out and Emerging Markets are biased also consolidating at long term resistance in their uptrend.
Volatility looks to remain low keeping the bias higher for the equity index ETF’s SPY, IWM and QQQ. Their charts show some short term retrenchment as they hit highs, while the long term rising trend remains unperturbed. Use this information as you prepare for the coming week and trad’em well.
The information in this blog post represents my own opinions and does not contain a recommendation for any particular security or investment. I or my affiliates may hold positions or other interests in securities mentioned in the Blog, please see my Disclaimer page for my full disclaimer.
