Last week’s review of the macro market indicators noted as the book closed on the 3rd Quarter, stocks awere driving to new all-time highs and looking very strong. Elsewhere looked for Gold (GLD (NYSE:GLD)) to continue its short term pullback while Crude Oil (USO (NYSE:USO)) continued to trend higher. The US Dollar Index (DXY) was consolidating after a long fall and might be ready to reverse while US Treasuries (iShares 20+ Year Treasury Bond (NASDAQ:TLT)) were biased to continue lower in the short term.
The Shanghai Composite ($ASHR) continued to consolidate and Emerging Markets (iShares MSCI Emerging Markets (NYSE:EEM)) were consolidating in their uptrend. Volatility (iPath S&P 500 VIX Short-Term Futures Exp 30 Jan 2019 (NYSE:VXX)) looked to remain subdued keeping the bias higher for the equity index ETF’s SPDR S&P 500 (NYSE:SPY), iShares Russell 2000 (NYSE:IWM)and PowerShares QQQ Trust Series 1 (NASDAQ:QQQ). Their charts all looked fabulous in the longer timeframe. The IWM might need a breather after a strong run while the SPY (NYSE:SPY) and QQQ also looked strong in the short run.
The week played out with Gold continuing lower while Crude Oil stalled and started to head lower. The US Dollar continued a slow creep higher while Treasuries continued to the downside. The Shanghai Composite was closed for the week while Emerging Markets moved back to the recent high.
Volatility kept inching lower, setting a new all-time low Thursday, and keeping the bias higher for equities. The Equity Index ETF’s all moved higher on the week, setting new all-time highs along the way. The SPY was the strongest moving up all week with the IWM stalling mid week after its stellar run and passing the baton back to the QQQ which broke higher late in the week. What does this mean for the coming week? Lets look at some charts.
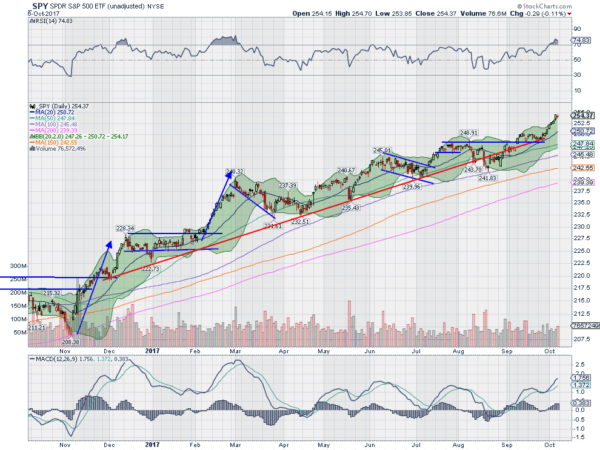
SPY Daily, SPY
The SPY printed a new all-time high to end the prior week and continued to move up all week. by Thursday it had made 4 more new all-time highs and was a whisper away from 255. Friday saw minor selling stalling out the win streak at 8 days in a row and printing an inside candle. This will bring out some top callers.
The daily chart shows the move higher a bit extended as Thursday ran out of the Bollinger Bands®. The RSI is also in overbought territory while the MACD continues higher above prior areas where price has stalled. Perhaps time for some consolidation.
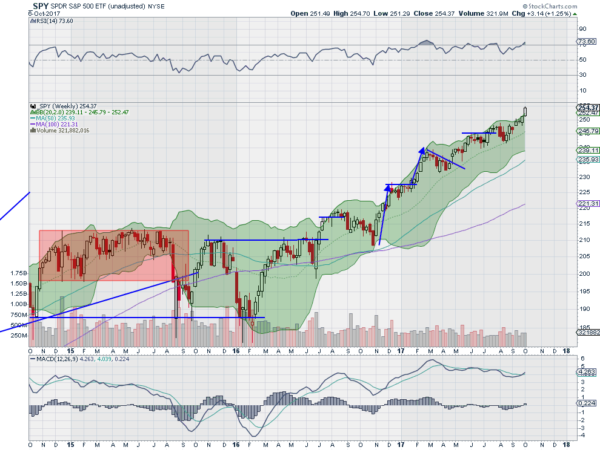
The weekly chart looks very strong though with a second strong white candle. It is outside of the Bollinger Bands though, but the RSI is strong and rising while the MACD is crossing up. There is no resistance over 254.70 and support lower comes at 252.50 and 250 then 248 and 246. Uptrend Continues, Perhaps Short Term Pause.
SPY Weekly, SPY
Heading into the next week the SPY and IWM look ready to hand over the lead to the QQQ as they take a breather after strong runs. Elsewhere look for Gold to continue lower while Crude Oil also moves to the downside. The US Dollar Index looks better to the upside short term while US Treasuries are biased lower. The Shanghai Composite and Emerging Markets are biased to the upside for the week.
Volatility looks to remain very low keeping the bias higher for the equity index ETF’s SPY, IWM and QQQ. Their charts all look great on the longer timeframe, while the SPY and IWM are extended in the shorter timeframe and could pause or pullback slightly. Use this information as you prepare for the coming week and trad’em well.
The information in this blog post represents my own opinions and does not contain a recommendation for any particular security or investment. I or my affiliates may hold positions or other interests in securities mentioned in the Blog, please see my Disclaimer page for my full disclaimer.
