Last week’s review of the macro market indicators suggested, heading into October Options Expiration that the picture for the equity markets was gloomy. Elsewhere looked for Gold to bounce in its downtrend while Crude Oil continued lower. The US Dollar Index was strong and biased higher along with US Treasuries . The Shanghai Composite also looked to head higher while Emerging Markets were biased to the downside. Volatility was on the cusp of a break out higher putting equities at risk. The charts of the Index ETF’s, S&P 500, iShares Russell 2000 Index (ARCA:IWM) and QQQ (NASDAQ:QQQ), showed that as well, with the iShares Russell 2000 Index (ARCA:IWM) starting a downtrend while the S&P 500 and QQQ were also biased lower in the short run, but looked stronger in the longer timeframe. The week could prove crucial for equities.
TThe week played out with Gold holding its gains while Crude Oil dropped hard before it rebounded late in the week. The US Dollar continued to digest its move higher while Treasuries spiked and pulled back to end the week. The Shanghai Composite moved up to test resistance but held a tight range while Emerging Markets consolidated at the lows. Volatility also spiked to multi-year highs send a shock wave through the markets. The Equity Index ETF’s continued their slide early in the week but the IWM reversed and the SPY and QQQ followed. Will it hold up and what does this mean for the coming week? Lets look at some charts.


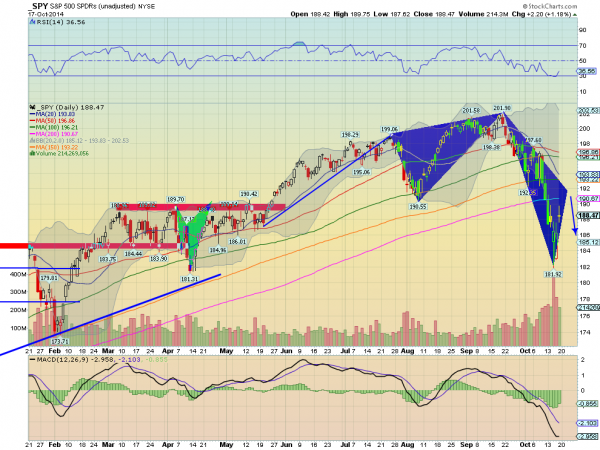
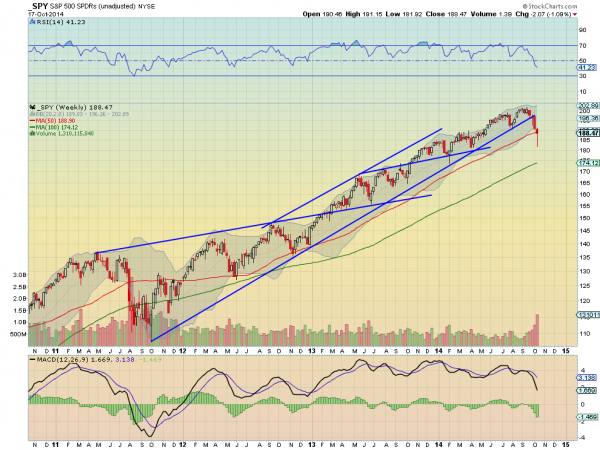
The SPY came into the week sitting on its 200 day SMA, raising questions of whether it would hold or not. They were answered quickly Monday with a strong move lower, closing on the low and outside of the lower Bollinger band. This consolidated Tuesday, back into the Bollinger bands, and then resumed lower Wednesday. The Hammer Wednesday signaled a possible reversal but the lower open and failure to make a higher close muddled that despite the Hollow Red candle, showing positive intraday action. Friday’s gap up did confirm a reversal though, but the doji print, signaling indecision, gives caution. The RSI and MACD both showed signs of bottoming and follow through higher would add weight to a reversal and a solid bottom. But we do not have that yet. In fact the price action since July is showing a bearish 5-0 harmonic pattern that would suggest a move to 191.90 would be a trigger to short. The weekly chart shows a Hammer on the 50 week SMA with the RSI still in the bullish zone, over 40. The ramp up in volume along with this supports the case for a bottom. But the MACD is continuing lower. There is support lower at 188.20 and 186 followed by 185 and 181.60. Resistance higher comes at 190.40 and 191.20 before 194. Possible Reversal of the Short Term Downtrend.
Heading into the week, equities markets look like they may have dodged a bullet, but still need to confirm that with a move higher. Elsewhere look for Gold to consolidate with an upward bias while Crude Oil remains biased lower, but is showing a possible bottom. The US Dollar Index looks to consolidate or resume the uptrend while US Treasuries are showing signs of a possible reversal lower. The Shanghai Composite looks ready to resume the uptrend while Emerging Markets are showing signs of a possible reversal higher. Volatility looks to remain elevated and biased to stay there despite the spike and pullback, keeping the bias lower for the equity index ETF’s SPY, IWM and QQQ. There charts show signs of reversal higher with the IWM leading, but all need to prove they want to reverse with a move higher this week, otherwise the risk is to the downside. Use this information as you prepare for the coming week and trad’em well.
The information in this blog post represents my own opinions and does not contain a recommendation for any particular security or investment. I or my affiliates may hold positions or other interests in securities mentioned in the Blog, please see my Disclaimer page for my full disclaimer.
