A weekly excerpt from the Macro Review analysis sent to subscribers on 10 markets and two timeframes.
Last week’s review of the macro market indicators noted heading into the last days of October the equity markets looked strong. Elsewhere looked for Gold (GLD (NYSE:GLD)) to continue lower in the short run while Crude Oil (USO (NYSE:USO)) looked for new 52 week highs. The US Dollar Index (DXY) had renewed strength and looked to continue higher while US Treasuries (TLT) were biased lower but at long term support.
The Shanghai Composite (ASHR) continued to make higher highs as it approached 2 year highs and Emerging Markets (iShares MSCI Emerging Markets (NYSE:EEM)) were holding on a retest of break out levels. Volatility (VXX) looked to remain very low keeping the bias higher for the equity index ETF’s SPDR S&P 500 (NYSE:SPY), IWM and PowerShares QQQ Trust Series 1 (NASDAQ:QQQ). Their charts also looked better higher on both the short and intermediate timeframe, though the iShares Russell 2000 (NYSE:IWM) might need a kick in the pants to get out of consolidation.
The week played out with Gold moving sideways until a drop Friday while Crude Oil continued the march higher. The US Dollar continued to move higher on the week while Treasuries found some footing and reversed higher. The Shanghai Composite drifted lower, bouncing off of 3400, while Emerging Markets rebounded to the upside.
Volatility moved lower down near 9, keeping the bias higher for equities. The Equity Index ETF’s were mixed on the week, with the QQQ racing higher while the SPY (NYSE:SPY) moved up at a more moderate pace and the IWM finished slightly. What does this mean for the coming week? Lets look at some charts.
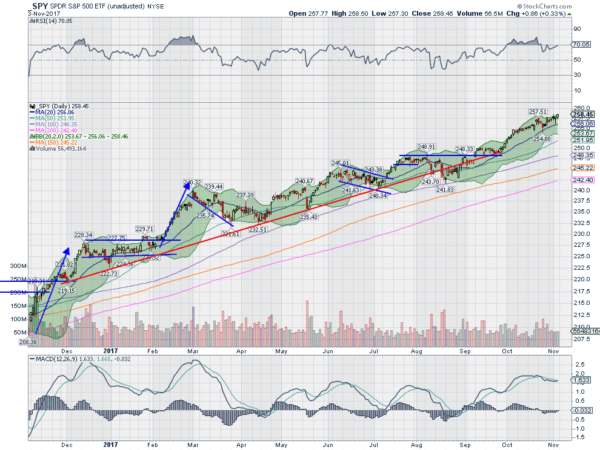
The SPY came into the week at an all-time high. Monday it printed a Harami, inside candle, followed by another Tuesday. The reversal camp started drooling. But Wednesday it moved higher to a new all-time high and then after a small pullback Thursday made another all-time high to close out the week.
The 2 new highs left the SPY with a gain of only 29 basis points on the week, less than a point. The daily chart shows the RSI moving up towards technically overbought territory again and the MACD is turning back up toward a bullish cross. The Bollinger Bands had squeezed and are giving it room higher now.
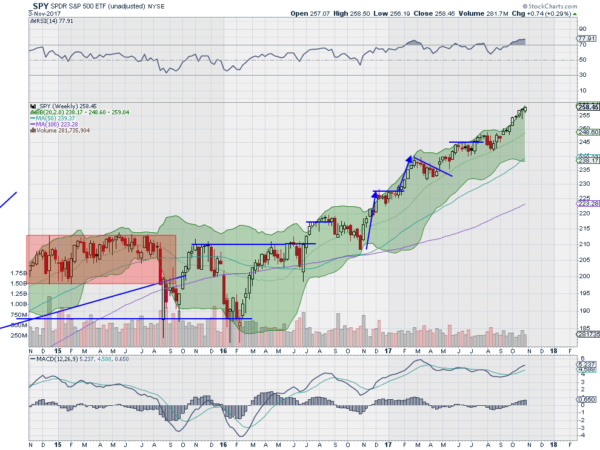
On the weekly chart price is riding the upper Bollinger Band as the RSI continues into overbought territory. It is still under 80 though so not near extreme. The MACD is also rising and bullish. There is no resistance higher and support is now at 256 and 254.50 followed by 252.50 and 250. Continued Uptrend.
Heading into the next week Equity markets are strong but mixed with the IWM lagging the SPY and that trailing a red hot QQQ. Elsewhere look for Gold to continue its short term downtrend while Crude Oil races higher. The US Dollar Index looks to continue its move up while US Treasuries join it in their short term trend higher. The Shanghai Composite and Emerging Markets look to consolidate their gains at multi-year highs.
Volatility looks to remain non-existent keeping the wind at the backs of the equity index ETF’s SPY, IWM and QQQ. The QQQ looks to continue higher leading the charge with the SPY moving up at a slower pace and the IWM sitting on the curb, watching as it consolidates. Use this information as you prepare for the coming week and trad’em well.
The information in this blog post represents my own opinions and does not contain a recommendation for any particular security or investment. I or my affiliates may hold positions or other interests in securities mentioned in the Blog, please see my Disclaimer page for my full disclaimer.


