Last week’s review of the macro market indicators noted with May options expiration behind and the last full trading week before Memorial Day kicks off the summer season ahead, equity markets were mixed. Elsewhere looked for Gold ($GLD) to continue its move lower while Crude Oil ($USO) continued in an uptrend. The US Dollar Index also looked to continue to move higher while US Treasuries ($TLT) trended lower.
The Shanghai Composite ($ASHR) looked to continue to bounce off of support and Emerging Markets ($EEM) remained in consolidation building there bull flag. Volatility ($VXX) looked to remain at very low levels keeping the bias higher for the equity index ETF’s SPDR S&P 500 (NYSE:SPY), iShares Russell 2000 (NYSE:IWM) and PowerShares QQQ Trust Series 1 (NASDAQ:QQQ). Their charts were mixed though. All looked strong on the weekly timeframe. And the IWM was leading to the upside making new all-time highs. The SPY (NYSE:SPY) and QQQ were in consolidation short term though with the QQQ looking the weaker of the two.
The week played out with Gold finding support early in the week and bouncing while Crude Oil found resistance and pulled back. The US Dollar continued its move higher and Treasuries reversed joining the Dollar to the upside. The Shanghai Composite stalled at the April high and reversed while Emerging Markets held firm over support.
Volatility held in a tight 2 point range all week, keeping the bias higher for equities. The Equity Index ETF’s held in tight ranges on the week moving mainly sideways, with the SPY and QQQ consolidating over the previous high and the IWM consolidating at new all-time highs. What does this mean for the coming week? Lets look at some charts.
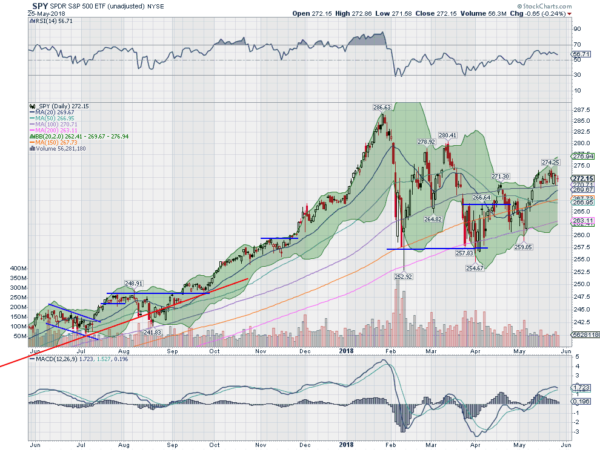
The SPY came into the week consolidating over the 100 day SMA and the April high. And it pretty much just held there all week. The daily chart shows a small pop to the upside Monday sold Tuesday and then reversed Wednesday before a couple of doji-like days to end the week. All told it held in a tight 3 1/2 point range ending slightly higher.
The daily chart shows the Bollinger Bands® remain pointing higher. The RSI is stalling just under the 60 level it would take to return to the bullish zone, and the MACD is rolling over towards a cross down, but positive. A very mixed bag.
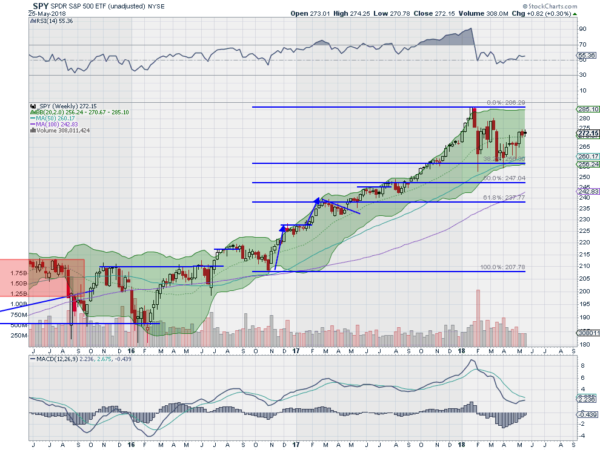
The weekly timeframe shows a second tight week after the break higher with the real body inside the prior week. The RSI is drifting up off of the mid line with the MACD approaching the signal line from below and positive. There is resistance above at 272.50 and 275 then 277.50 and 279 before 280. Support lower comes at 271.40 and 269 then 267.50 and 265. Consolidation Continues.
Heading into Memorial Day Weekend, the unofficial start of summer, equity markets remain in consolidation. Elsewhere look for Gold to possibly confirm a reversal higher while Crude Oil pulls back hard in the uptrend. The US Dollar Index looks to continue to move to the upside while US Treasuries race higher in the short term. The Shanghai Composite looks to have resumed the downtrend and Emerging Markets continue to hold over support, marking time.
Volatility looks to remain at very low levels keeping the bias higher for the equity index ETF’s SPY, IWM and QQQ. Despite that good news equities continue to plod along sideways mainly. The longer timeframe remains constructive with the IWM leading in the shorter timeframe but the QQQ looking to catch up. Use this information as you prepare for the coming week and trad’em well.
The information in this blog post represents my own opinions and does not contain a recommendation for any particular security or investment. I or my affiliates may hold positions or other interests in securities mentioned in the Blog, please see my Disclaimer page for my full disclaimer.


