A weekly excerpt from the Macro Review analysis sent to subscribers on 10 markets and two time frames.
Last week’s review of the macro market indicators noted that as May began, equity markets continued to move sideways in consolidation without any energy, but with a slightly improving picture. Elsewhere it looked for gold (GLD) to hold or bounce off of support in its range while Crude Oil (USO) continued higher. The US Dollar Index (DXY) continued to show strength in the short term moving higher while US Treasuries (TLT) were consolidating at a lower high, a possible Dead Cat Bounce.
The Shanghai Composite (ASHR) was consolidating in a downtrend clinging to support while Emerging Markets (EEM) continued to retrench in the uptrend. Volatility (VXX) looked to remain low and more stable taking pressure off of the equity index ETF’s SPDR S&P 500 (NYSE:SPY), iShares Russell 2000 (NYSE:IWM) and PowerShares QQQ Trust Series 1 (NASDAQ:QQQ). Their charts all ended the prior week stronger on the shorter time frame and in consolidation near the top on the longer time frame. In the short term the QQQ and IWM looked a bit stronger than the SPY.
The week played out with gold holding at support before a small move higher Friday, while crude oil had a hiccup move lower before recovering to end the week slightly higher. The US Dollar continued higher early in the week but then retreated to even while Treasuries moved lower early before recovering. The Shanghai Composite started higher off of support with Emerging Markets moving back higher as well.
Volatility continued to drift lower, ending at 3 month lows, and giving aid to the equity markets. The Equity Index ETF’s moved higher on the week, with the IWM the first to make a higher high. This was followed by the QQQ and then the SPY making higher highs. Not time to sound the all clear signal yet, but improving. What does this mean for the coming week? Let's look at some charts.
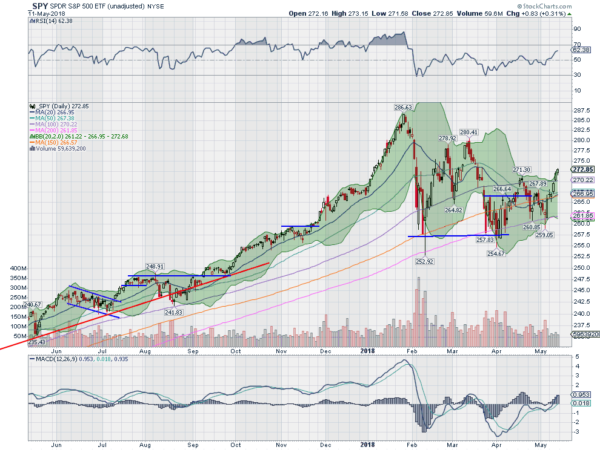
SPY Daily
The SPY came into the week following a stellar move to the upside Friday, confirming a Hammer reversal. Monday it gapped up and printed a doji at prior resistance, killing the buzz from Friday, and Tuesday held in place. Wednesday, it started higher though and continued the rest of the week. It ended the week above the April 28 high, a higher high following a higher low, but still off of the January peak.
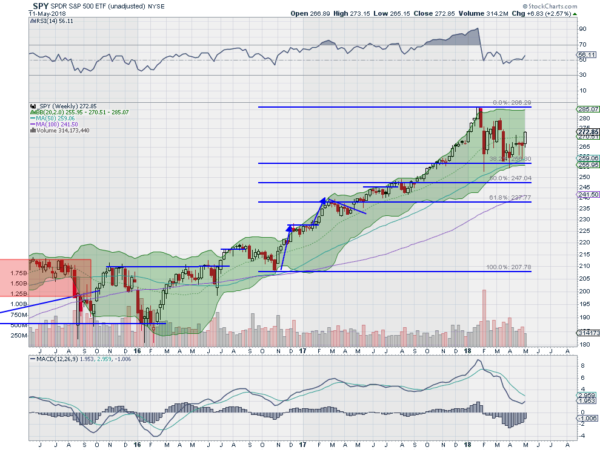
The daily chart shows the Bollinger Bands® opening to allow a continued move higher with the RSI now back in the bullish zone over 60. The MACD is rising and positive as well. These support more short term upside. The weekly chart shows the strong move higher following 3 weeks of narrow range candles. It also clearly shows the work ahead to resume a longer term bull market, a move over the March 12 the week high and then the all-time high.
The RSI is rising up off of the mid line (note it has not moved into the bearish zone yet under 40) with the MACD positive and turning up towards a cross. There is resistance at 275 and 279 then 280 and 283 before the all-time high. Support lower comes at 272.50 and 271.40 then 269 and 267.50 before 265 and 262.50. Nascent Short Term Uptrend in Consolidation.
SPY Weekly
Heading into May options expiration week, the equity markets have regained some swagger short term, but remain consolidating below all-time highs. Elsewhere, look for gold to continue its short term bounce off of the bottom of a range while crude oil continues to move higher. The US Dollar Index may be ending its short term bounce while US Treasuries consolidate at recent lows. The Shanghai Composite is bouncing off of support but Emerging Markets continue to build a bull flag off of their January high.
Volatility looks to continue to drift lower towards very low levels keeping the bias higher for the equity index ETF’s SPY, IWM and QQQ. Their charts all confirmed short term uptrends this week, making higher highs following higher lows, and look set to continue. Longer term they still have work to do to resume the uptrend, with the IWM on the verge of that confirmation and the QQQ and SPY trailing behind. Use this information as you prepare for the coming week and trad’em well.
The information in this blog post represents my own opinions and does not contain a recommendation for any particular security or investment. I or my affiliates may hold positions or other interests in securities mentioned in the Blog, please see my Disclaimer page for my full disclaimer.
