Last week’s review of the macro market indicators noted with the 4th of July behind, slow holiday trading had begun and it seemed to be good for equities so far. Elsewhere looked for Gold ($GLD) to bounce in its downtrend while Crude Oil ($USO) might pause in its uptrend. The US Dollar Index ($DXY) was also pausing in its uptrend while US Treasuries (TLT) were breaking out to the upside.
The Shanghai Composite ($ASHR) continued to look better lower but may have a short term pause while Emerging Markets (EEM) might be reversing to the upside after a several months long pullback. Volatility ($VXX) looked to continue to creep lower keeping the bias higher for the equity index ETF’s SPDR S&P 500 (NYSE:SPY), iShares Russell 2000 (NYSE:IWM) and PowerShares QQQ Trust Series 1 (NASDAQ:QQQ). Their charts all looked good in the long term with the IWM the strongest in the short run, but the SPY (NYSE:SPY) and QQQ were reversing higher out of support.
The week played out with Gold losing the bounce and falling back while Crude Oil held up early then fell mid week and consolidated. The US Dollar found support and moved slightly higher while Treasuries were rocked Monday but recovered by Friday. The Shanghai Composite found its footing and drifted up while Emerging Markets made a small move higher.
Volatility held in a tight range in the low teens, keeping the bias higher for equities. The Equity Index ETF’s reacted in mixed fashion, with the QQQ rising to new all-time highs and the SPY to nearly 6 month highs. The IWM however stalled Monday and pulled back without making a new high. What does this mean for the coming week? Lets look at some charts.
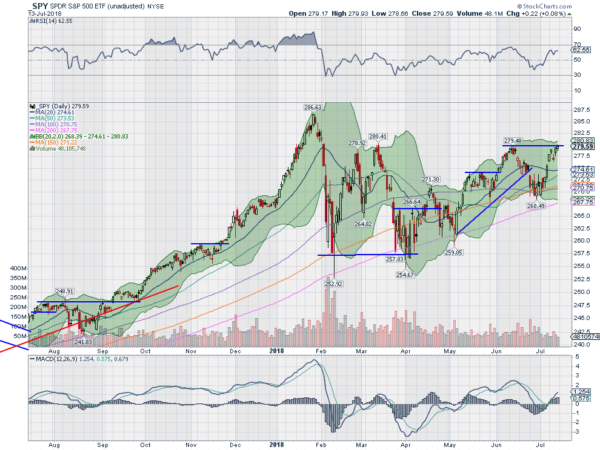
The SPY had moved up out of a bottoming consolidation at the end of last week. Monday saw that continue with a move higher. It followed on Tuesday before a small set back Wednesday. Thursday it pushed back higher to the June high and added a small gain Friday for the highest close since February 1st. This 278 to 280 area has stopped moves higher 3 times before. Now it is a 4th attempt to break through.
The daily chart shows the resistance and the RSI holding high in the bullish zone. The MACD is rising and positive and has a long way to run until it is at prior extremes. The Bollinger Bands® are quite flat, but might be starting to open on the upper side. A close over 280 would be a major bullish event.
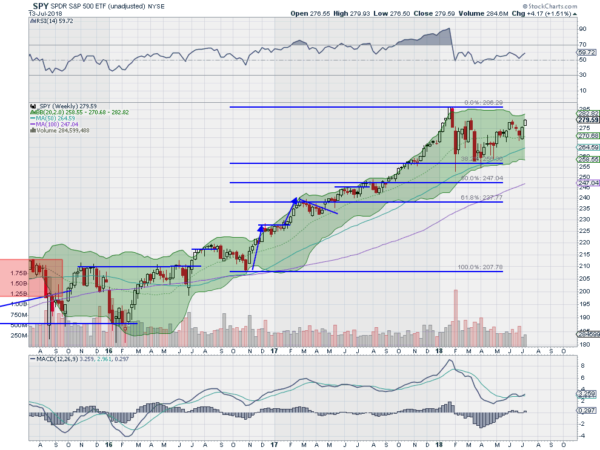
On the weekly timeframe the SPY printed a second candle opening at the low and closing at the high. The RSI on this timeframe is pushing higher in the bullish zone with the MACD positive and moving higher. A higher high after a higher low, an uptrend. There is resistance at 280 and 283 then 286. Support lower comes at 279 and 277.50 followed by 274.50 and 272.50. Nascent Uptrend.
Heading into July options expiration week there has been a shift in short term leadership in the equity markets back to the QQQ from the IWM with the SPY continuing to improve. Elsewhere look for Gold to continue lower while Crude Oil consolidates in its uptrend. The US Dollar Index continues to pause in its uptrend while US Treasuries continue to move higher. The Shanghai Composite may be building a bottom after a long drop and Emerging Markets are showing signs of a possible reversal to the upside after their long drop.
Volatility looks to be back at extreme low levels and holding keeping the bias higher for the equity index ETF’s SPY, IWM and QQQ. Their charts all look strong on the longer timeframe with the QQQ leading the charge. On the shorter timeframe signs of a pause are showing in the IWM while the SPY and QQQ are continuing higher. Use this information as you prepare for the coming week and trad’em well.
The information in this blog post represents my own opinions and does not contain a recommendation for any particular security or investment. I or my affiliates may hold positions or other interests in securities mentioned in the Blog, please see my Disclaimer page for my full disclaimer.


