A weekly excerpt from the Macro Review analysis sent to subscribers on 10 markets and two timeframes.
Last week’s review of the macro market indicators noted as 2017 came to a close the equity markets limped into the last day of the year, but held near their all-time highs. Elsewhere looked for Gold ($GLD) to continue its uptrend while Crude Oil ($USO) broke higher as well. The US Dollar Index ($DXY) continued broad consolidation but with risk to the downside while US Treasuries ($TLT) were biased higher in their broad consolidation.
The Shanghai Composite (ASHR) and Emerging Markets (iShares MSCI Emerging Markets (NYSE:EEM)) both continued to consolidate, the Chinese market after a pullback while Emerging Markets did so in their uptrend. Volatility (VXX) looked to remain very low keeping the wind at the backs of the equity index ETF’s SPDR S&P 500 (NYSE:SPY), iShares Russell 2000 (NYSE:IWM) and PowerShares QQQ Trust Series 1 (NASDAQ:QQQ). Their charts showed short term consolidation of the long uptrends with digestion, while the longer frames remained strong.
The week played out with Gold moving higher all week while Crude Oil moved higher but met resistance and consolidated. The US Dollar drifted slightly lower on the week while Treasuries found support and held. The Shanghai Composite had a strong bounce to the upside while Emerging Markets made new 7 year highs each day this week.
Volatility held in a tight range near all-time lows, keeping the bias higher for equities. The Equity Index ETF’s broke hard to the upside, with the SPY (NYSE:SPY) and QQQ leading the charge and making multiple new all-time highs including Friday while the IWM looks strong and closed Friday at an all-time high. What does this mean for the coming week? Lets look at some charts.
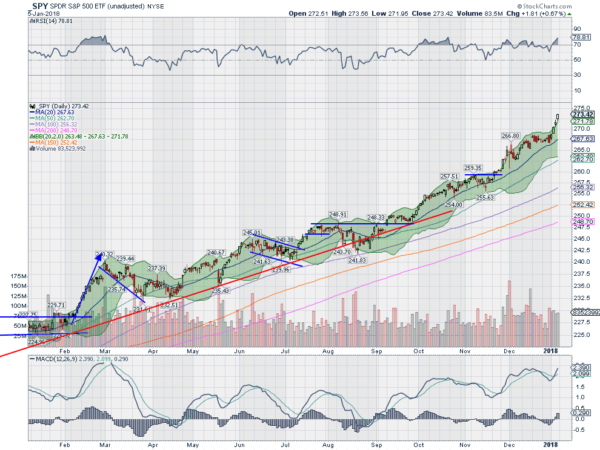
SPY Daily, $SPY
The SPY had just rejected at a test of the all-time high as it entered the New Year. Momentum had faded, the chart set up for a short term pullback. Baaaahaaa, it would have none of that. A move higher Tuesday to a new all-time high was followed up by another Wednesday and continuation Thursday and Friday. Four trading days in 2018 and four new all-time highs.
The daily chart shows that it has moved out of the Bollinger Bands® though, and the RSI is the most overbought it has been since late October. That only created a pause back then. The MACD crossed up and is rising though. In total on the short timeframe a strong market that could use a rest or digestive pullback to reset.
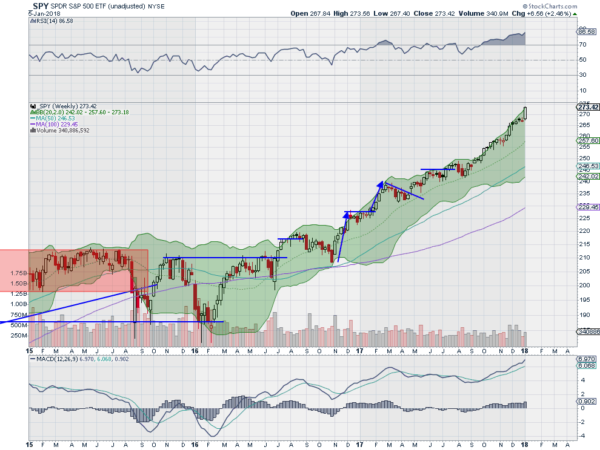
On the weekly timeframe the move up out of consolidation was exceptional. The RSI is well into overbought territory with the MACD rising. The Bollinger Bands are not a limiting factor on this timeframe. There is no resistance higher, and support lower comes at 268.50 then 267.50 and 266.50 before 265.50 and 262.50. Continued Uptrend.
SPY Weekly, $SPY
With the first week of the New Year under our belts equity markets look spectacular, and maybe have run a bit too far too fast. Elsewhere look for Gold to continue in its uptrend while Crude Oil may pause in its move higher. The US Dollar Index is weak but may be finding support while US Treasuries are biased lower in consolidation. The Shanghai Composite and Emerging Markets have both broken to the upside in a strong manner out of consolidation.
Volatility looks to remain very low keeping the bias higher for the equity index ETF’s SPY, IWM and QQQ. Their charts agree on the longer timeframe, with the SPY and QQQ very strong and the IWM just starting to break out. On the shorter timeframe the SPY and QQQ are overbought and may need a pause, perhaps giving rise to rotation in to the IWM. Use this information as you prepare for the coming week and trad’em well.
The information in this blog post represents my own opinions and does not contain a recommendation for any particular security or investment. I or my affiliates may hold positions or other interests in securities mentioned in the Blog, please see my Disclaimer page for my full disclaimer.
