Last week’s review of the macro market indicators noted heading into the 3 day weekend for Martin Luther King Day the equity markets continued to fire on all cylinders. Elsewhere looked for Gold (Gold Futures) to continue in its uptrend while Crude Oil ($USO) blazed its own path higher. The US Dollar Index ($DXY) was in trouble and possibly on the verge of a break down while US Treasuries (TLT) consolidated in a broad range.
The Shanghai Composite ($ASHR) and Emerging Markets ($EEM) had broken their consolidation to the upside and looked to continue higher. Volatility (VXX) looked to remain at very low levels keeping the bias higher for the equity index ETF’s SPDR S&P 500 (NYSE:SPY) , iShares Russell 2000 (NYSE:IWM) and PowerShares QQQ Trust Series 1 (NASDAQ:QQQ). The IWM had finally joined the party moving to new highs while the SPY (NYSE:SPY) and QQQ continued to trade in tandem. Their charts all looked strong on both the short and long time frame.
The week played out with Gold finding resistance and pausing while Crude Oil also met sellers and stalled. The US Dollar continued lower early but held the rest of the week while Treasuries moved higher to start but gave it all back, still within their range. The Shanghai Composite continued to move higher along with Emerging Markets, both ending at multi-year highs.
Volatility crept higher early in the week but not meaningfully and gave back some of the gain Friday. This kept the bias higher for equities. The Equity Index ETF’s held in tight ranges on the week near their all-time highs, after making new intraday highs to start the week, and then surging to close at new all-time highs. What does this mean for the coming week? Lets look at some charts.
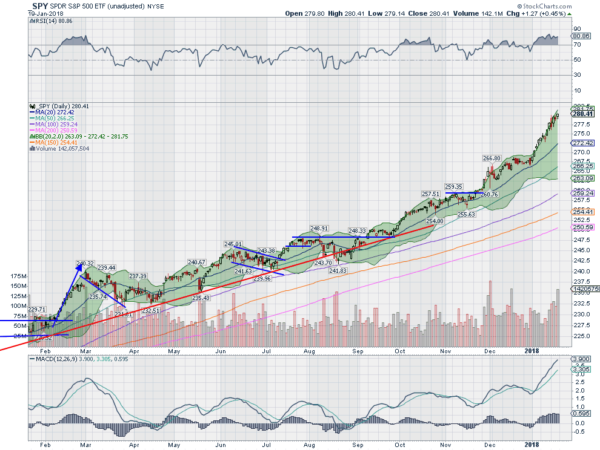
SPY Daily, $SPY
The SPY came into the week following a two week run higher. It started to the upside Tuesday with a big gap up but then sold off the rest of the day. Wednesday returned to green through and it closed at another all-time high. It paused with an inside day Thursday before making another all-time high close Friday, the 10th of 2018.
The daily chart shows the price continuing to extend above the 20 day SMA and looks to be the most extended in over a year. The RSI is overbought but has been moving sideways for two weeks. The MACD continues to print higher levels with no sign of stopping. All this adds up to a few reasons to be cautious, but not reasons to sell. Overbought conditions and extended moves can also work off through time heading sideways.
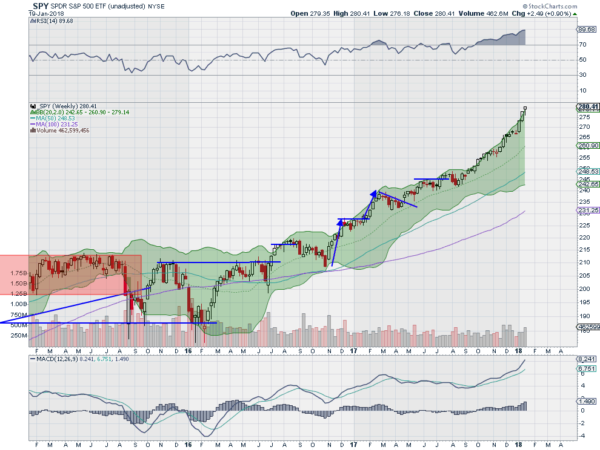
The weekly chart is also strong and printing a 3rd weekly closing all-time high in a row. Every week this year. The RSI on this timeframe is closing in on 90, that is hot! The MACD is also rising and high. There is no resistance above. And support lower comes at 278 and 275 followed by 273 and 269. Uptrend Continues.
SPY Weekly, $SPY
With January Options Expiration behind, the Equity markets look extremely strong and perhaps overheated. Elsewhere look for Gold to pause in its uptrend while Crude Oil slows as it hits resistance as well. The US Dollar Index looks destined to move lower while US Treasuries are biased lower in consolidation. The Shanghai Composite and Emerging Markets are poised to continue to new multi-year highs.
Volatility looks to remain at very low levels keeping the bias higher for the equity index ETF’s SPY, IWM and QQQ. They are lining up on both the shorter and longer timeframe now with the SPY overheated and at extreme momentum levels, the QQQ also overbought but not quite extreme, while the IWM is just getting going. This could easily lead to rotation into the IWM from the other Indexes. Use this information as you prepare for the coming week and trad’em well.
The information in this blog post represents my own opinions and does not contain a recommendation for any particular security or investment. I or my affiliates may hold positions or other interests in securities mentioned in the Blog, please see my Disclaimer page for my full disclaimer.
