Last week’s review of the macro market indicators noted heading into the dog days of August the equity markets were looking poised for a move. Elsewhere looked for Gold (SPDR Gold Shares (NYSE:GLD)) to possibly pause in the downtrend while Crude Oil (United States Oil (NYSE:USO)) held at support in the uptrend. The US Dollar Index (US Dollar Index) was in a possible reversal higher while US Treasuries (iShares 20+ Year Treasury Bond (NASDAQ:TLT)) were pulling back in consolidation.
The Shanghai Composite (Deutsche X-trackers Harvest CSI 300 China A-Shares (NYSE:ASHR)) was renewing its downtrend and Emerging Markets (iShares MSCI Emerging Markets (NYSE:EEM)) were bouncing in a pullback. Volatility (iPath S&P 500 VIX Short-Term Futures Exp 30 Jan 2019 (NYSE:VXX)) looked to remain very low keeping the bias higher for the equity index ETF’s SPDR S&P 500 (NYSE:SPY), iShares Russell 2000 (NYSE:IWM) and PowerShares QQQ Trust Series 1 (NASDAQ:QQQ). Their charts also showed strength with the SPY leading the charge in the short term, the IWM right behind it and the QQQ trying to reverse higher.
The week played out with Gold pausing and holding over support while Crude Oil made a lower low before reversing Friday. The US dollar held flat early but exploded higher at the end of the week while Treasuries bounced and ended higher. The Shanghai Composite retested the July low and bounced while Emerging Markets stalled and dropped sharply Friday.
Volatility continued lower all week until a bounce Friday brought it to the teens, lightening the breeze it was providing to equities. The Equity Index ETF’s reacted in mixed fashion, with the SPY and QQQ rising to just shy of all-time highs and then seeing profit taking Friday, but the IWM lagging a bit on the upside, further from prior highs, but also giving up very little Friday. What does this mean for the coming week? Lets look at some charts.
SPY Daily

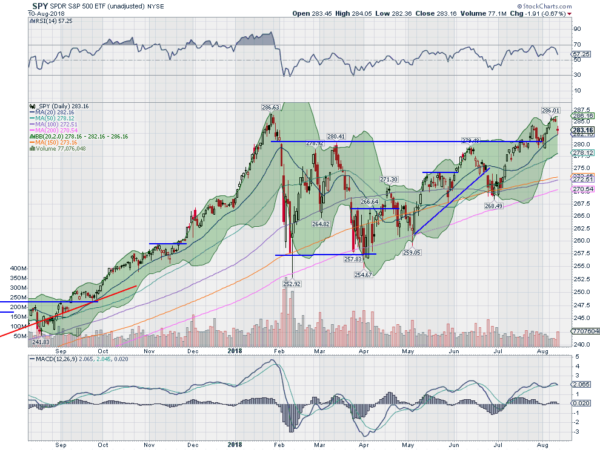
The SPY was rising toward the July high as the week began. It continued higher Monday and then Tuesday broke through only to see Wednesday and Thursday hold, without follow through. Friday gapped down to the 20 day SMA and held for a down week. The daily chart shows it turning back at the January high. The RSI is bullish but turning back down with the MACD near a cross down. These suggest possible consolidation or digestion to continue short term.
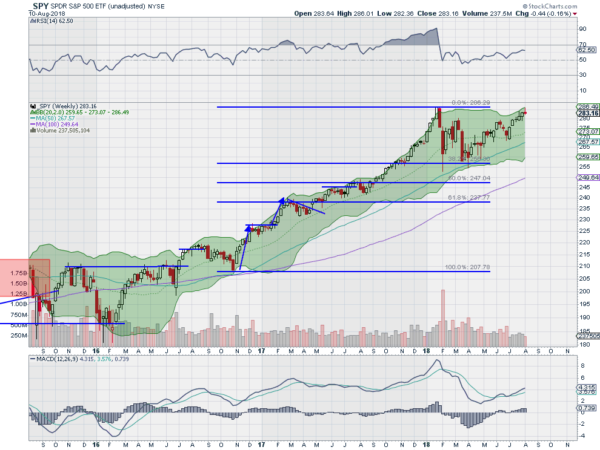
The weekly chart shows a small red candle after 5 straight up weeks. The RSI on this time frame is rising and bullish with the MACD rising and positive. The Bollinger Bands® are also shifted higher. There is resistance at 286 above and a Measured Move to 290. Support lower comes at 283 and 280 then 279 and 277.5 before 274.5. Uptrend.
SPY Weekly

Heading into August Options Expiration week, the equity markets continue to look strong on the longer time frame, but may need a rest in the short run. Elsewhere look for Gold to possibly pause in its downtrend while Crude Oil bounces at support after a pullback on the uptrend. The US Dollar Index is breaking out to the upside and looks strong while US Treasuries are bouncing in consolidation. The Shanghai Composite may be ready to pause in its downtrend while Emerging Markets continue lower.
Volatility looks to remain low but creeping up into the teens removing the aid it has been giving to equities. The equity index ETF’s SPY, IWM and QQQ, all look strong on the weekly timeframe. But on the shorter charts the SPY may continue the short term pullback along with the QQQ while the IWM consolidates at the highs. Use this information as you prepare for the coming week and trad’em well.
The information in this blog post represents my own opinions and does not contain a recommendation for any particular security or investment. I or my affiliates may hold positions or other interests in securities mentioned in the Blog, please see my Disclaimer page for my full disclaimer.
