Last week’s review of the macro market indicators noted as the books closed on the 1st Quarter of trading the equity indexes had their first down quarter in over 2 years and were hanging onto long term bullish trends by a thread. Elsewhere looked for Gold to consolidate with a downward bias while Crude Oil (USO (NYSE:USO)) turned from an uptrend to consolidation. The US Dollar Index (DXY) continued to move sideways while US Treasuries (iShares 20+ Year Treasury Bond (NASDAQ:TLT)) were biased higher.
The Shanghai Composite (ASHR) and Emerging Markets (iShares MSCI Emerging Markets (NYSE:EEM)) looked to continue to consolidate, the Shanghai Composite at the retest of lows and Emerging Markets at their highs. Volatility (iPath S&P 500 VIX Short-Term Futures Exp 30 Jan 2019 (NYSE:VXX)) looked to remain elevated keeping pressure on the equity index ETF’s SPDR S&P 500 (NYSE:SPY), iShares Russell 2000 (NYSE:IWM) and PowerShares QQQ Trust Series 1 (NASDAQ:QQQ). Their charts showed that the bleeding had stopped in the short run, but no strength for a reversal at this point. That said the longer trend remained to the upside.
The week played out with Gold starting higher but finding resistance and falling back near unchanged while Crude Oil reversed lower out of consolidation. The US Dollar spent more time drifting slightly higher in the consolidation range while Treasuries worked their way lower. The Shanghai Composite sat still at the start of the week and then rolled into a 5 day weekend while Emerging Markets held over support for yet another week.
Volatility cracked below 20 late in the week but bounced slightly Friday to stay over it, keeping a slight headwind for equities. The Equity Index ETF’s had another wild ride, starting the week moving lower then finding support mid week and rising Thursday only to give enough back Friday to finish down on the week. A real roller coaster ride. What does this mean for the coming week? Lets look at some charts.
SPY (NYSE:SPY) Daily
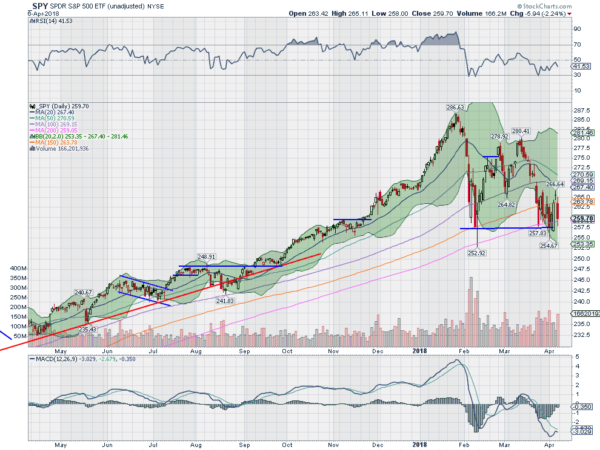
The SPY entered the week after a week of consolidation over the 200 day SMA after touching it again. This was also at the February lows. Monday broke lower, below the range and through the 200 day SMA, retesting the 38.2% retracement of the move higher following the Presidential election. Tuesday was an inside day, a Harami, and with Wednesday’s Bullish Engulfing Candle the signals were there for a reversal higher.
We got a move higher Thursday with a gap up but a doji star, and Friday dropped back, closing the gap and finishing back near the 200 day SMA. Three big range days that left the SPY only slightly lower on the week. The daily chart shows the RSI turning back lower at the mid line with the MACD failing to cross up and turning back lower. Another week holding at the February low.
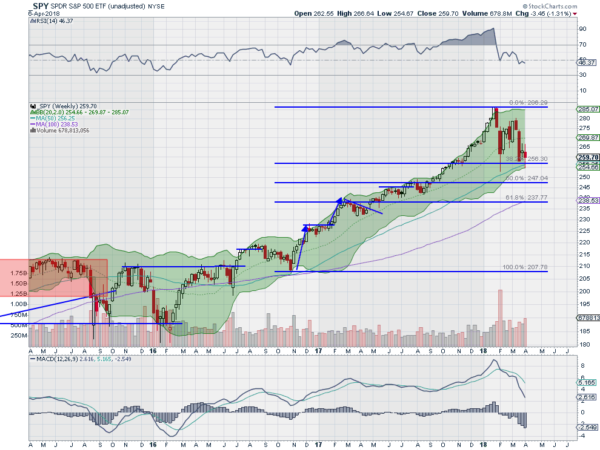
The weekly chart shows a second candle with long upper and lower shadows and a small real body, an indecision candle. This time it touched the 50 week SMA before moving back higher. The RSI is still in the bullish range, just below the mid line but falling with the MACD falling hard. The lower shadow also touched the lower Bollinger Band® for the first time since the election week. There is support lower at 257.50 and 255 followed by 253.50 and 250. Resistance higher comes at 260 and 262.50 followed by 265 and 267 then 269. Continued Consolidation.
As we head into the next week the equity markets continue to hold onto long term uptrends, consolidating in broader ranges. They also printed nearly identical weeks, ending lower. Elsewhere look for Gold to continue to consolidate in a broad range while Crude Oil consolidates with a bias lower. The US Dollar Index looks to mark time sideways while US Treasuries consolidate with a bias higher.
The Shanghai Composite returns after a short week stuck in a range at the February lows while Emerging Markets continue to build a bull flag at the highs. Volatility looks to remain elevated creating a headwind for the equity index ETF’s SPY, IWM and QQQ. Their charts show broad consolidation after the recent pullback with the QQQ at greatest risk of a move lower. Use this information as you prepare for the coming week and trad’em well.
The information in this blog post represents my own opinions and does not contain a recommendation for any particular security or investment. I or my affiliates may hold positions or other interests in securities mentioned in the Blog, please see my Disclaimer page for my full disclaimer.

