SPY, QQQ Are Still Oversold And On Buy Signal

Published 01/11/2016, 12:15 AM
Updated 07/09/2023, 06:31 AM
US500
-
SPY
-
1YMH25
-
IXIC
-

S&P 500 Chart

NASDAQ Chart

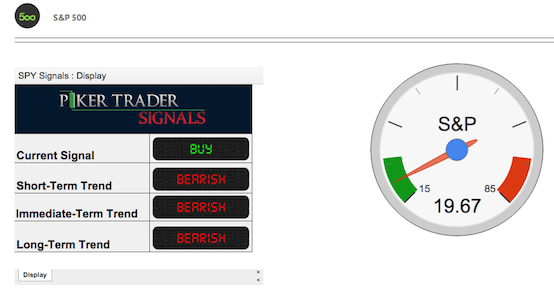
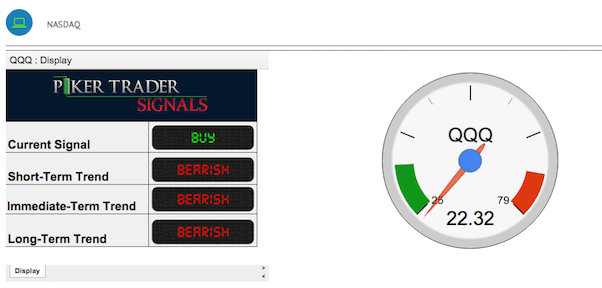
Friday, we expected the market to bounce which it did in the AM but sold off the rest of the day especially as the end. Our indicators are still oversold and a buy signal the S&P 500, NASDAQ and the Dow Jones. In fact breadth was slightly better then Thursday sell off, so there is a slight positive divergence going on underneath the market. But there are a lot of factors in the global economy that can put continued pressure on this market.

Looking at SPY we can see that SPDR S&P 500 (N:SPY) is nearing the lows of 2015 and a potential support area. The market bounced off these lows twice in 2015 and now provides a potential bouncing area or a stop-loss area. A move below this levels and our indicator moving off oversold buy would signal us to get the losses and wait for a new signal.
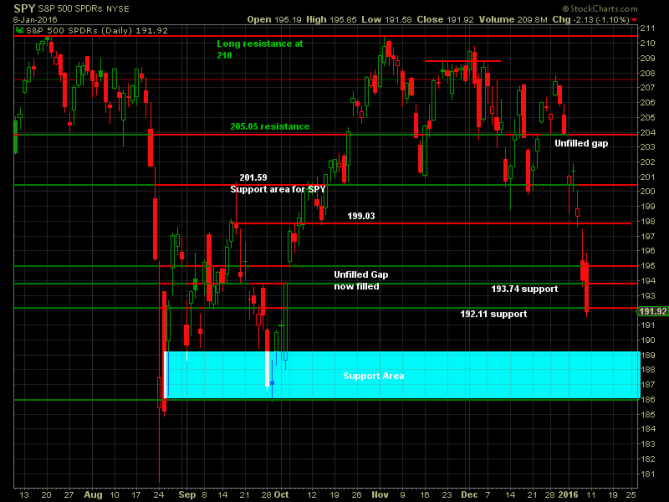
SPY Daily Chart

The Q's are at similar level touching a support levels. The Q's charts look a little strong then the SPDR S&P 500 (N:SPY) but in a very similar situation. The are of support for the Q's is 104-101, below this would be trouble for the bulls and a good stop area.
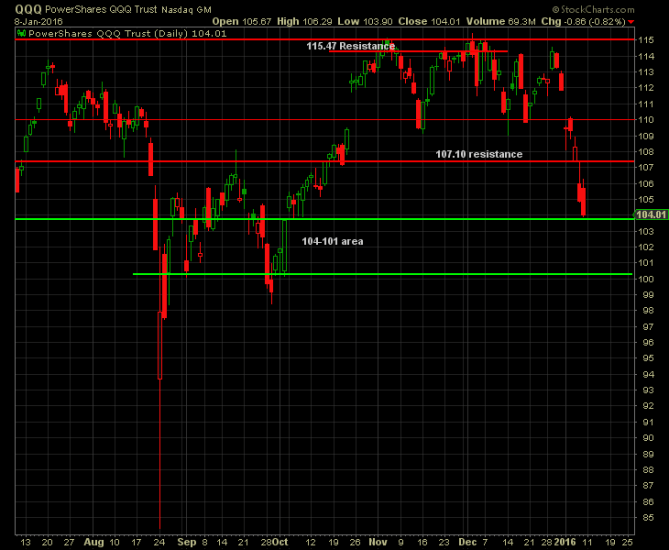
QQQ Daily Chart

Latest comments

Loading next article…
Risk Disclosure: Trading in financial instruments and/or cryptocurrencies involves high risks including the risk of losing some, or all, of your investment amount, and may not be suitable for all investors. Prices of cryptocurrencies are extremely volatile and may be affected by external factors such as financial, regulatory or political events. Trading on margin increases the financial risks.
Before deciding to trade in financial instrument or cryptocurrencies you should be fully informed of the risks and costs associated with trading the financial markets, carefully consider your investment objectives, level of experience, and risk appetite, and seek professional advice where needed.
Fusion Media would like to remind you that the data contained in this website is not necessarily real-time nor accurate. The data and prices on the website are not necessarily provided by any market or exchange, but may be provided by market makers, and so prices may not be accurate and may differ from the actual price at any given market, meaning prices are indicative and not appropriate for trading purposes. Fusion Media and any provider of the data contained in this website will not accept liability for any loss or damage as a result of your trading, or your reliance on the information contained within this website.
It is prohibited to use, store, reproduce, display, modify, transmit or distribute the data contained in this website without the explicit prior written permission of Fusion Media and/or the data provider. All intellectual property rights are reserved by the providers and/or the exchange providing the data contained in this website.
Fusion Media may be compensated by the advertisers that appear on the website, based on your interaction with the advertisements or advertisers.
© 2007-2025 - Fusion Media Limited. All Rights Reserved.