Yesterday, even the bulls were taken off guard as technology companies and financial shares pushed higher, and U.S. stock indexes hit fresh record highs. The CBOE Volatility Index (VIX) surpassed its all-time low, gold sank to a two month low, and has been down four weeks in a row.
There are not many people that get to speak to one of the world’s greatest traders every day, but I do. After doing the PitBull S&Ps on the CME floor for over 20 years, I got to learn a lot about some of the tools he uses. A long time ago he used to give me his daily ‘channels’. They worked great for many years, but as more program trading hit the S&P, they became less effective. Yesterday, while talking to him, he said ‘all the old wisdom doesn’t mean anything anymore’. And then asked if I agree, my answer was yes!
While this really isn’t anything new, the markets are constantly evolving. If a new indicator works, it only works for awhile, or until the algos program it into their systems. The last time volatility was this low was in 1964, and with the VIX trading under 9.50, the markets overlook every negative.
Picking A Top Can Be A Tough Way To Go; S&P 500 Closes At Another New High, Its Longest Winning Streak Of Record Closes In 20 Years
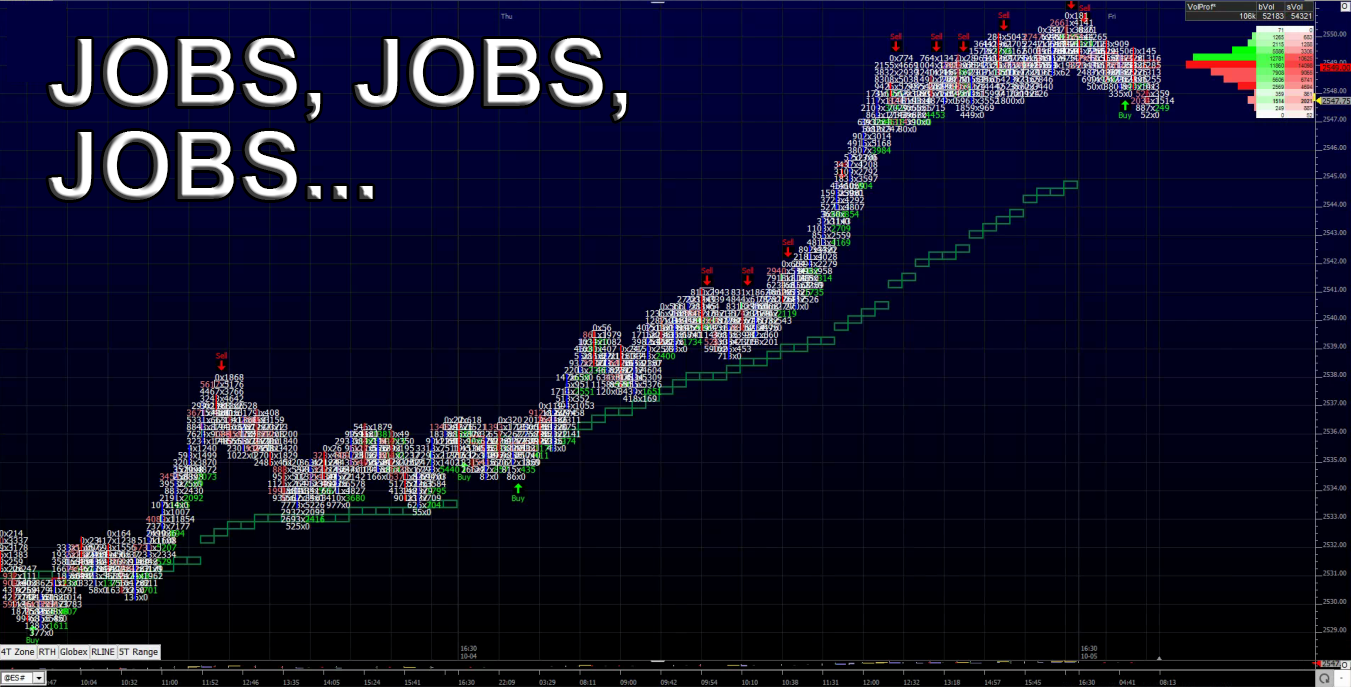
Yesterday, at 9:30 CT, after opening at 2538.25, the ES down ticked to 2537.25 and then traded up to 2541.00. After another small pullback that held the vwap, the ES traded up to 2542.00 at 10:00 CT. Around 10:30 CT the ES got hit by a very large ‘buy program’ pushing the ES all the way up to 2549.25… The algo’s don’t sell, they only buy.
One thing no one was talking about were all the SPX, SPY (NYSE:SPY) and SPY option collars. As the futures continued to move higher, the short call sellers had three choices, cover, roll higher or buy ES futures. After a 2 handle pull back the ES started going back up again as the MiM started showing $175 million, and then $262 million to buy, and traded up to 2550.00 at 2:15 CT. The PitBull said ‘no one has see this in 30 years.’ The MiM jumped up to $710 million to buy, and the actual 2:45 cash imbalance came out MOC buy $782 million. The ES pulled back 2.25 handles down to 2547.75, and then traded up to a new high at 2550.75 on the close.
In the end is was one big all day buy program, and in the end, the S&P 500 futures (ESZ17:CME) settled at 2550.00, up +13.75 handles, or +0.54%, the Dow Jones futures (YMZ17:CBT) settled at 22740, up +133 points, or +0.58%, the Nasdaq 100 futures (NQZ17:CME) settled at 6065.75, up +61.75 points, or +1.01% and the Russell 2000 (RTYZ17:CME) settled at 1515.50, up +4.10 points or +0.27% on the day.
S&P 500 IS DOING SOMETHING IT DID JUST BEFORE BLACK MONDAY
The SPX is headed for an eighth straight win and sixth straight record close
By Andrea Kramer #SPX
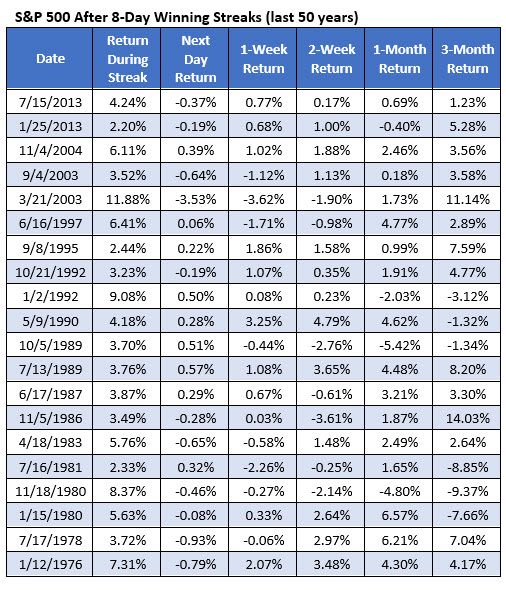
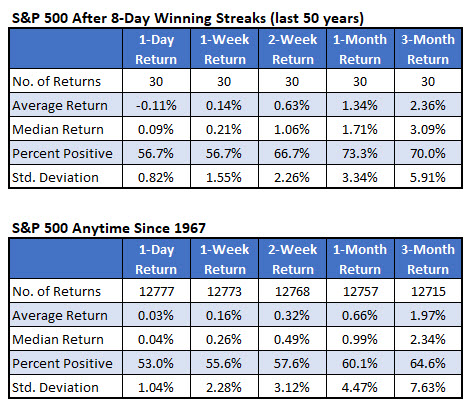
The S&P 500 Index (SPX) is on pace for an eighth straight day of gains, which would represent its longest winning streak in four years. In addition, another higher finish today would mark the SPX’s sixth consecutive record close — a feat not accomplished in 20 years, and one that preceded Black Monday 30 years ago. Against this backdrop, we decided to take a look at how the stock market tends to fare after these lengthy rallies.
SPX Pacing for Smallest Gain During an 8-Day Rally Ever
During the SPX’s last eight-day winning streak, the index tacked on 4.2%, according to data from Schaeffer’s Senior Quantitative Analyst Rocky White. From its Sept. 25 close at 2,496.66 to its current perch at 2,548.63, the S&P has added roughly 2.1%, which would represent the smallest return during an eight-day winning streak in at least 50 years. Currently, the smallest return during one of these streaks is 2.2%, which happened during the early 2013 rally. Prior to 2013, you’d have to go back to late 2004 for an eight-day run higher.
9-Day Rallies Rare for S&P 500
Record-Setting Streaks Have Preceded Notorious Stock Market Drops
As alluded to earlier, a record close today would mark the S&P 500 Index’s sixth straight — a feat not accomplished since June 1997. In fact, there were four of these stretches in the 1990s, during the dot-com boom, and two in 1987, just before Black Monday, 30 years ago. It’s also worth noting that one of these signals occurred in November 1972, just before the bear market of 1973-1974, and twice in 1961, prior to the “Flash Crash of 1962.”
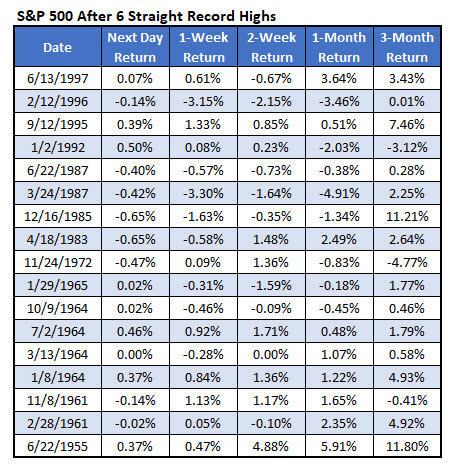
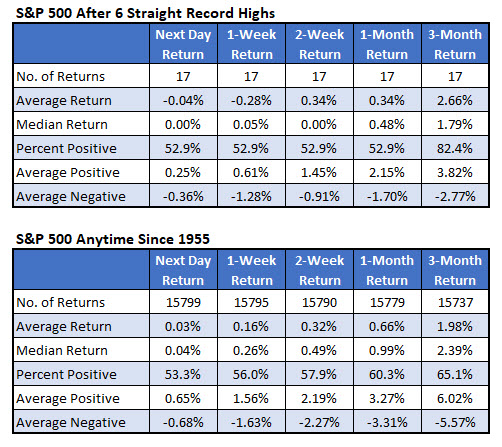
Looking at S&P performance after at least six straight record high closes, the index has averaged a negative return both the next day and one week after these record-setting runs, and averaged a gain of just 0.34% one month later — about half its anytime one-month gain, going back to 1955. However, three months after these streaks, the SPX was up 2.66%, on average, and higher 82.4% of the time. That’s better than the index’s average anytime three-month gain of 1.98%, with 65.1% positive.
While You Were Sleeping
Overnight, equity markets in Asia held onto their gains, and closed higher across the board. Meanwhile, in Europe, stocks are trading mixed, with a bias to the downside, as investors await this mornings jobs data.
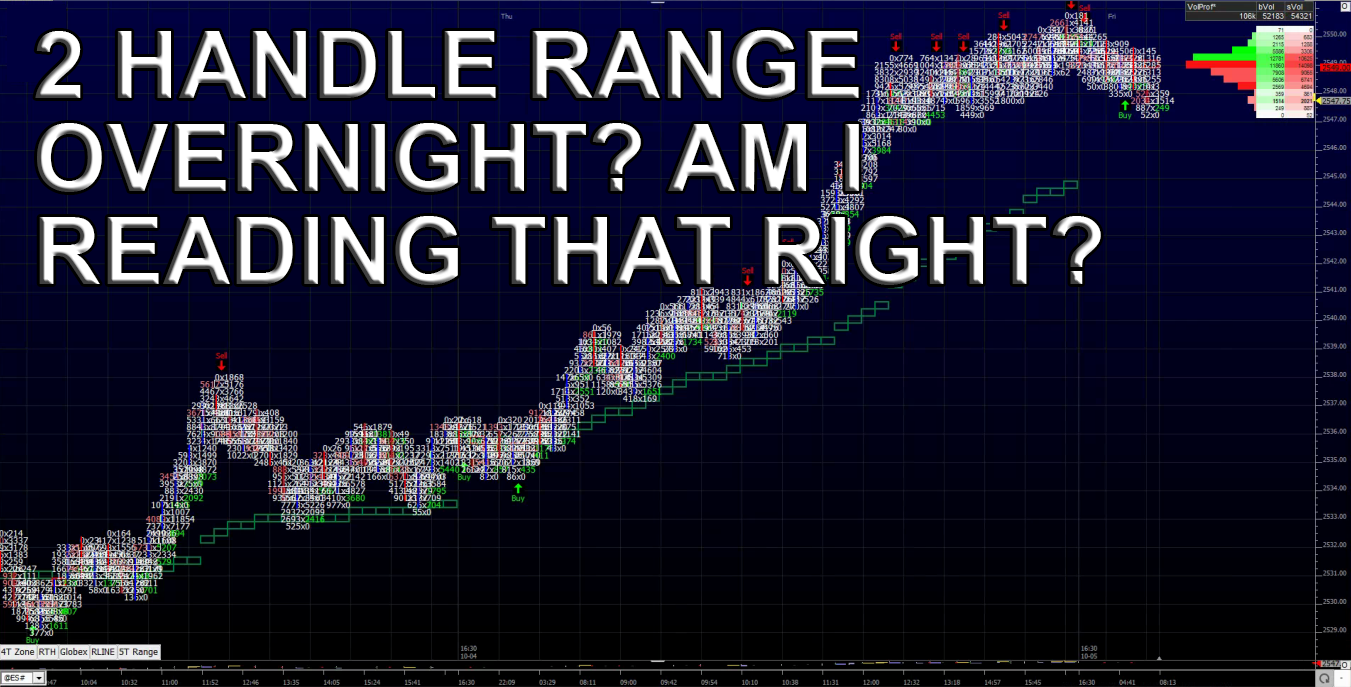
In the U.S., the S&P 500 futures opened last night’s globex session at 2548.75, and that’s where it stayed for the rest of the night. The ES was held to just a 1.75 handle range overnight. I can’t ever remember such a small trading overnight. As of 7:00 am CT, the last print in the ES is 2548.00, down -1.50 handles, with 92k contracts traded.
In Asia, 11 out of 11 markets closed higher (Shanghai +0.29%), and in Europe 8 out of 12 markets are trading lower this morning (FTSE +0.13%).
Today’s economic includes Employment Situation (8:30 a.m. ET), Wholesale Trade (10:00 a.m. ET), Baker-Hughes Rig Count (1:00 p.m. ET); Fedspeak — Raphael Bostic Speaks (9:15 a.m. ET), William Dudley Speaks (12:15 p.m. ET), Robert Kaplan Speaks (12:45 p.m. ET), James Bullard Speaks (1:50 p.m. ET)
VIX Falls 4.6% to 9.19, Surpassing Its All-time Low of 9.31 Set In December 1993
Our View: http://money.cnn.com/data/fear-and-greed/If there was any one trading rule to abide, it’s that the trend really is your friend, and don’t forget it. CNN’s Fear and Greed Index was 36 a month ago, and shot up to 94 yesterday ( ). Obviously greed has taken over. Today the main event is the US September jobs report. Will it matter? I don’t know, but what i do know is everyone that trades options rolled higher, and the S&P 500 futures have closed higher 7 days in a row.
Our view is that by the time the ES does sell off, it will have run every short out of the game. What we do know is the ES is long overdue for a pull back, but it’s been that way for days. I do think things have, or are close to, reaching an extreme, but with the volumes so low, who’s to say the markets can’t keep going up? I am sorry I can’t be more helpful, but like I have said many times, picking a top is hard to do!
